


Select the correct answer from each drop-down menu.
The table below represents the function f,...

Mathematics, 14.02.2020 04:11, gamelaza431
Select the correct answer from each drop-down menu.
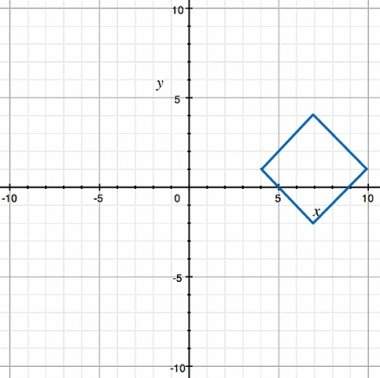
The table below represents the function f, and the following graph represents the function g.
x -6 -5 -4 -3 -2 -1 0 1
f(x) 8 -2 -8 -10 -8 -2 8 22
Complete the following statements.
The functions f and g have .
The y-intercept of f is the y-intercept of g.
Over the interval [-6, -3], the average rate of change of f is the average rate of change of g.

Answers: 1
Other questions on the subject: Mathematics
Mathematics, 21.06.2019 17:30, nurmukhammada
Can someone me with this problem i don't understand i need
Answers: 2
Mathematics, 21.06.2019 22:00, nshuey0930
Worth 100 points need the answers asap first row -x^2 2x^2 (x/2)^2 x^2 x is less than 2 x is greater than 2 x is less than or equal to 2 x is greater than or equal to 2 second row -5 -5/2 4 5 •2 is less than x& x is less than 4 •2 is less than or equal to x & x is less than or equal to 4 •2 is less than or equal to x& x is less than 4 •2 is less than x& x is less than or equal to 4
Answers: 2
Mathematics, 21.06.2019 23:10, jaylenmiller437
Astudent draws two parabolas on graph paper. both parabolas cross the x-axis at (–4, 0) and (6, 0). the y-intercept of the first parabola is (0, –12). the y-intercept of the second parabola is (0, –24). what is the positive difference between the a values for the two functions that describe the parabolas? write your answer as a decimal rounded to the nearest tenth
Answers: 2
Do you know the correct answer?
Questions in other subjects:


World Languages, 20.05.2021 01:40

History, 20.05.2021 01:40
English, 20.05.2021 01:40


Chemistry, 20.05.2021 01:40


