

Mathematics, 13.02.2020 20:51, takaylawynder
The accompanying data represent the miles per gallon of a random sample of cars with a three-cylinder, 1.0 liter engine. a. Compute the z-score corresponding to the individual who obtained 37.8 miles per gallon. Interpret this result. b. Determine the quartiles. c. Compute and interpret the interquartile range, IQR. d. Determine the lower and upper fences. Are there anyoutliers?31.5 36.0 37.8 38.5 40.1 42.234.2 36.2 38.1 38.7 40.6 42.534.7 37.3 38.2 39.5 41.4 43.435.6 37.6 38.4 39.6 41.7 49.3The z-score corresponding to the individual is and indicates that the data value is ___ standard deviation(s) the .

Answers: 1
 ,
,  = 37.80
 ,
, ==> 1.96
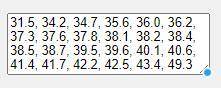


Other questions on the subject: Mathematics
Mathematics, 21.06.2019 17:30, kirsten8605
If the measure of angle 1 is 110 degrees and the measure of angle 3 is (2 x+10 degree), what is the value of x?
Answers: 2
Mathematics, 21.06.2019 21:40, melinalange48
What is the value of x in the equation 1.5x+4-3=4.5(x-2)?
Answers: 2
Mathematics, 22.06.2019 00:00, jadfavors4321
Parallelogram efgh is a rectangle. he = 6, and fe = 8. find ge: and find fj:
Answers: 1
Do you know the correct answer?
The accompanying data represent the miles per gallon of a random sample of cars with a three-cylinde...
Questions in other subjects:


Health, 14.12.2021 14:00

English, 14.12.2021 14:00
Biology, 14.12.2021 14:00

Computers and Technology, 14.12.2021 14:00


