Mathematics, 11.02.2020 21:43, algahimnada
The table below shows the ages of houses to the nearest year in a neighborhood. Using the age of the houses as the random
variable, X, which graph shows the probability distribution, Px(x), of a randomly chosen house?

Answers: 1
Other questions on the subject: Mathematics

Mathematics, 20.06.2019 18:02, cutiecat66
This is a table of values that follows a given rule or function. each output comes from the input being applied to the rule.
Answers: 1

Mathematics, 21.06.2019 15:30, CoreyHammond1517
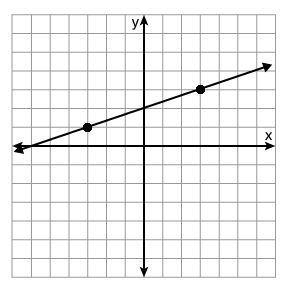
Click on the y intercept. -x +4 i know you cant click on it so could you just say the coordinates like (example - (1,0) you so much.
Answers: 2

Mathematics, 21.06.2019 19:00, issaaamiaaa15
You got a job selling magazines door-to-door. you are paid $100 per day plus $1.50 for each magazine you sell. which recursive formula models this situation?
Answers: 1

Mathematics, 22.06.2019 00:30, OperatorBravo
Which equation represents h for right triangle abc
Answers: 1
Do you know the correct answer?
The table below shows the ages of houses to the nearest year in a neighborhood. Using the age of the...
Questions in other subjects:

Mathematics, 15.04.2020 19:55

Mathematics, 15.04.2020 19:55


History, 15.04.2020 19:56


