
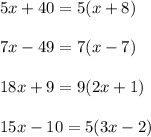


Factorise 5x + 40
7x - 49
18x + 9
15x - 10...

Answers: 3
Other questions on the subject: Mathematics

Mathematics, 21.06.2019 15:00, Shavaila18
The data shown in the table below represents the weight, in pounds, of a little girl, recorded each year on her birthday. age (in years) weight (in pounds) 2 32 6 47 7 51 4 40 5 43 3 38 8 60 1 23 part a: create a scatter plot to represent the data shown above. sketch the line of best fit. label at least three specific points on the graph that the line passes through. also include the correct labels on the x-axis and y-axis. part b: algebraically write the equation of the best fit line in slope-intercept form. include all of your calculations in your final answer. part c: use the equation for the line of best fit to approximate the weight of the little girl at an age of 14 years old.
Answers: 3
Mathematics, 21.06.2019 22:20, stalley1521
Which of the following is missing in the explicit formula for the compound interest geometric sequence below?
Answers: 1
Mathematics, 22.06.2019 01:30, lexyjasmin6781
Write the equation of the circle centered at (10,-2) with radius 2
Answers: 2
Do you know the correct answer?
Questions in other subjects:

Physics, 19.04.2021 15:10


Advanced Placement (AP), 19.04.2021 15:10

English, 19.04.2021 15:10

Mathematics, 19.04.2021 15:10


