

Mathematics, 26.01.2020 06:31, nofer
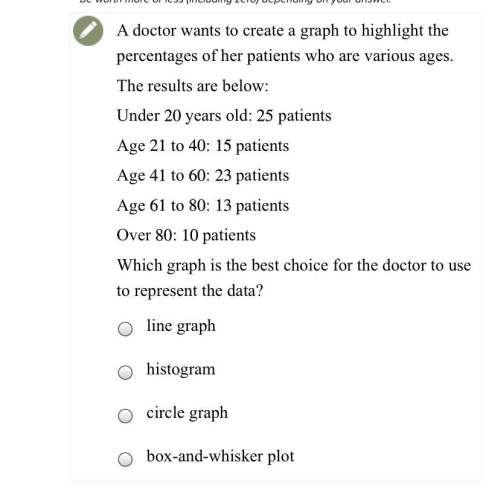
Adoctor wants to create a graph to highlight the percentages of her patients who are various ages.
the results are below:
under 20years old: 25patients
age 21 to 40: 15patients
age 41 to 60: 23patients
age 61 to 80: 13patients
over 80: 10 patients
which graph is the best choice for the doctor to use to represent the data?
a. line graph
b. histogram
c. circle graph
d. box-and-whisker plot

Answers: 3


Other questions on the subject: Mathematics
Mathematics, 21.06.2019 18:00, phamleson8697
Use the distributive law to multiply. 3(4x + 5y + 6)
Answers: 2
Mathematics, 21.06.2019 20:30, cgarnett5408
Find the magnitude, correct to two decimal places, made by each of the following with positive direction of the x axis a) y= x the answer is 45° but i don’t know how
Answers: 2
Mathematics, 21.06.2019 22:30, 19thomasar
Atotal of 766 tickets were sold for the school play. they were either adult tickets or student tickets. there were 66 more student tickets sold than adult tickets. how many adult tickets were sold?
Answers: 1
Mathematics, 21.06.2019 23:30, sandrafina2004
Sally deposited money into a savings account paying 4% simple interest per year. the first year, she earned $75 in interest. how much interest will she earn during the following year?
Answers: 2
Do you know the correct answer?
Adoctor wants to create a graph to highlight the percentages of her patients who are various ages.
Questions in other subjects:


