


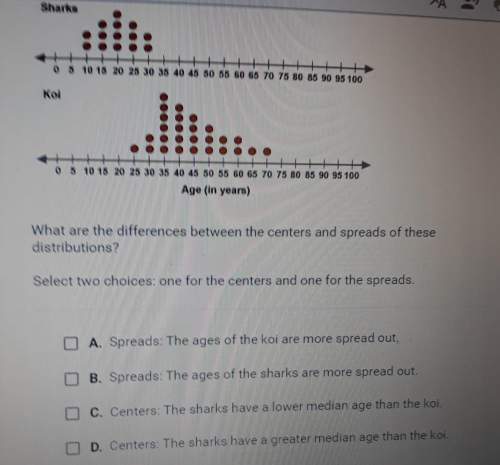
These dot plots show the ages in years for a sample of two types of fish.
...

Mathematics, 22.01.2020 19:31, jailinealvarado24
These dot plots show the ages in years for a sample of two types of fish.

Answers: 2
Other questions on the subject: Mathematics
Mathematics, 21.06.2019 22:30, pedroramirezr2
What is the graph of the absolute value equation ? y=|x|-5
Answers: 1
Do you know the correct answer?
Questions in other subjects:


Mathematics, 18.11.2020 17:30
Mathematics, 18.11.2020 17:30


Biology, 18.11.2020 17:30
Mathematics, 18.11.2020 17:30


