


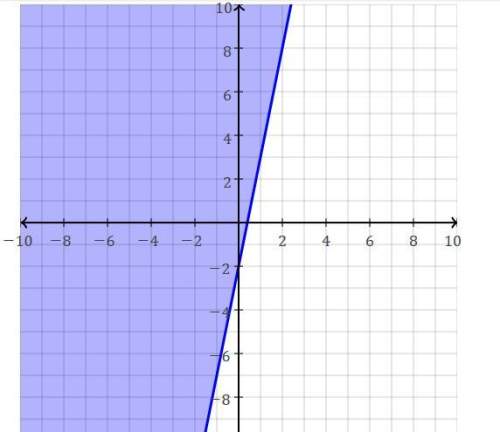
Which inequality does the given graph represent?
a) y ≤ 5x + 2
b) y ≤ 5x −...

Mathematics, 20.01.2020 19:31, SsjDavid
Which inequality does the given graph represent?
a) y ≤ 5x + 2
b) y ≤ 5x − 2
c) y ≥ 5x − 2
d) y > 5x − 2

Answers: 1
Other questions on the subject: Mathematics
Mathematics, 21.06.2019 13:50, sweetcandy16gaming
What are the vertical asymptotes of the function f(x) =5x+5/x2 + x-2
Answers: 1
Mathematics, 21.06.2019 21:00, millie54
Two cars which are 40 miles apart start moving simultaneously in the same direction with constant speeds. if the speed of the car which is behind is 56 mph and the speed of the other car is 48 mph, how many hours will it take for the car which is behind to catch up the car ahead of it?
Answers: 2
Mathematics, 21.06.2019 23:30, sindy35111
Atown has a population of 17000 and grows at 2.5% every year. to the nearest year, how long will it be until the population will reach 19600?
Answers: 1
Do you know the correct answer?
Questions in other subjects:


