
 , where f(w) is the number of a specific product produced after w weeks.
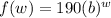 ............. (1)
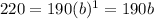


50 points show your work
the function represents the number of specialty items produced at the...

Mathematics, 17.01.2020 21:31, helper49
50 points show your work
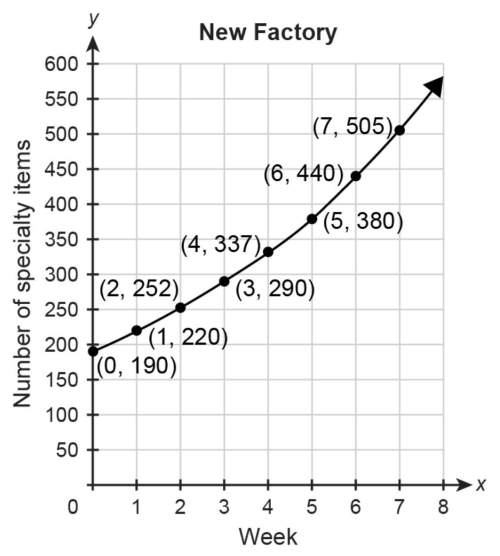
the function represents the number of specialty items produced at the old factory w weeks after a change in management. the graph represents the number of specialty items produced at the new factory during the same time period.
find and compare the growth rates in the weekly number of specialty items produced at each factory. show your work.

Answers: 2
Other questions on the subject: Mathematics
Do you know the correct answer?
Questions in other subjects:
Mathematics, 13.09.2020 06:01

Geography, 13.09.2020 06:01

Physics, 13.09.2020 06:01
Mathematics, 13.09.2020 06:01
Mathematics, 13.09.2020 06:01
Mathematics, 13.09.2020 06:01

English, 13.09.2020 06:01
Mathematics, 13.09.2020 06:01
Mathematics, 13.09.2020 06:01
English, 13.09.2020 06:01


