

Mathematics, 14.01.2020 17:31, blake2001
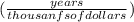
Table below shows the age in years and the retail value in thousands of dollars of a random sample of ten automobiles of the same make and model.
x 2 3 3 3 4 4 5 5 5 6
y 28.7 24.8 26.0 30.5 23.8 24.6 23.8 20.4 21.6 22.1
a) construct the scatter diagram.
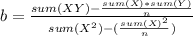
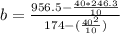
b) compute the linear correlation coefficient r. interpret its value in the context of the problem.
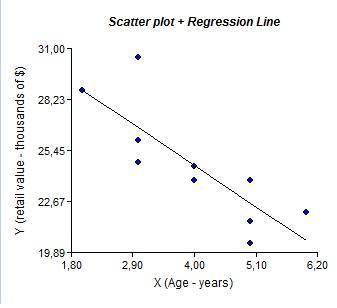
c) compute the least squares regression line. plot it on the scatter diagram.
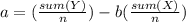
interpret the meaning of the slope of the least squares regression line in the context of the problem.
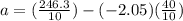
d) suppose a four-year-old automobile of this make and model is selected at random. use the regression equation to predict its retail value.
e) suppose a 20 -year-old automobile of this make and model is selected at random. use the regression equation to predict its retail value. interpret the result.
f) comment on the validity of using the regression equation to predict the price of a brand new automobile of this make and model.

Answers: 2
![r= \frac{sum(XY)-\frac{sum(X)*sum(Y)}{n} }{[sum(X^2)-\frac{(sum(X))^2}{n}] * [sum(Y^2)-\frac{(sum(Y))^2}{n} ] }](/tpl/images/0454/5277/ab4de.png)
![r= \frac{956.5-\frac{40*246.3}{10} }{[147-\frac{(40)^2}{10}] * [6154.15-\frac{(246.3)^2}{10} ] }](/tpl/images/0454/5277/2d906.png)
 is the modification of the estimated mean of the retail value of automobiles every time their age increases one year. In other words, every time the automobiles increase their age in one year, the price decreases 2.05 thousands of dollars.
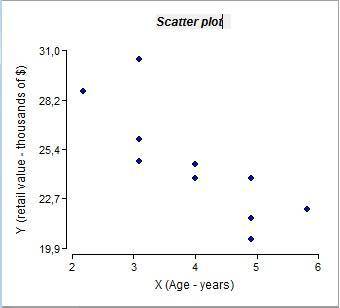


Other questions on the subject: Mathematics
Mathematics, 21.06.2019 12:30, vanessam16
Listed below are the measured radiation absorption rates? (in w/kg) corresponding to 11 cell phones. use the given data to construct a no plot and identify the 5- number summary
Answers: 2
Do you know the correct answer?
Table below shows the age in years and the retail value in thousands of dollars of a random sample o...
Questions in other subjects:
Mathematics, 03.06.2021 19:20

SAT, 03.06.2021 19:20


