


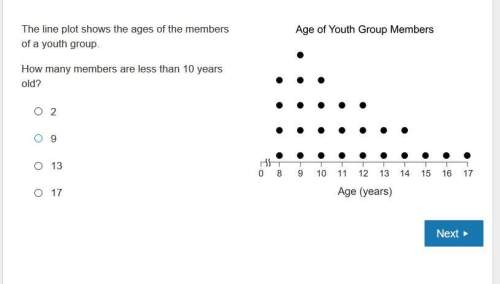
The line plot shows the ages of the members of a youth group.
how many members are less t...

Mathematics, 14.01.2020 01:31, jtswagg6634
The line plot shows the ages of the members of a youth group.
how many members are less than 10 years old?
a 2
b 9
c 13
d 17

Answers: 3
Other questions on the subject: Mathematics
Mathematics, 21.06.2019 22:00, Isaiahgardiner5143
Arefrigeration system at your company uses temperature sensors fixed to read celsius (°c) values, but the system operators in your control room understand only the fahrenheit scale. you have been asked to make a fahrenheit (°f) label for the high temperature alarm, which is set to ring whenever the system temperature rises above –10°c. what fahrenheit value should you write on the label?
Answers: 3
Mathematics, 22.06.2019 00:40, sonyarucker
Can you divide 25 into 4 equal groups? explain why or why not.
Answers: 1
Mathematics, 22.06.2019 01:00, shayshayyy41
Ataxi company charges $3 for pick-up plus $0.65 for each mile. select the expressions that represent the cost in dollars for a taxi pick-up and m miles. mark all that apply.
Answers: 1
Do you know the correct answer?
Questions in other subjects:

English, 05.10.2019 11:30
Mathematics, 05.10.2019 11:30

Social Studies, 05.10.2019 11:30
Social Studies, 05.10.2019 11:30

History, 05.10.2019 11:30

Computers and Technology, 05.10.2019 11:30
History, 05.10.2019 11:30

Geography, 05.10.2019 11:30


