

Mathematics, 11.01.2020 03:31, daphnewibranowsky
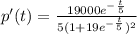
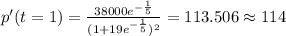
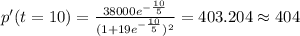
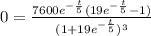
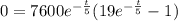
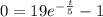
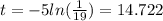
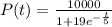
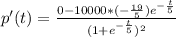
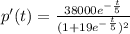
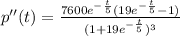
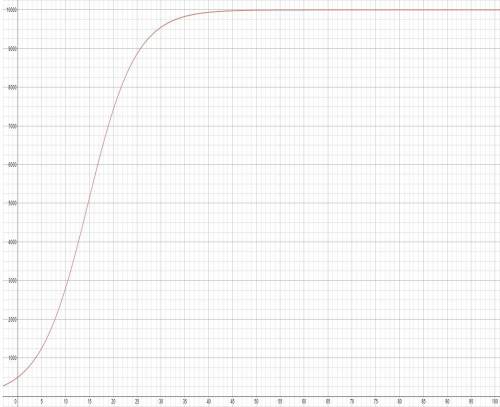
Population growth a lake is stocked with 500 fish, and their population increases according to the logistic curve where t is measured in months. use a graphing utility to graph the function. what is the limiting size of the fish population? at what rates is the fish population changing at the end of 1 month and at the end of 10 months? after how many months is the population increasing most rapidly?

Answers: 1


Other questions on the subject: Mathematics
Mathematics, 21.06.2019 18:00, kyasnead8189
Henry is an avid reader, he devours 90 pages in half an hour how many pages has henry read per minute?
Answers: 1
Mathematics, 21.06.2019 18:40, haidenmoore92
Which of the following would be a good name for the function that takes the weight of a box and returns the energy needed to lift it?
Answers: 1
Do you know the correct answer?
Population growth a lake is stocked with 500 fish, and their population increases according to the l...
Questions in other subjects:

Biology, 05.05.2020 21:32


Advanced Placement (AP), 05.05.2020 21:32
Mathematics, 05.05.2020 21:32
Mathematics, 05.05.2020 21:32

English, 05.05.2020 21:32
Mathematics, 05.05.2020 21:32
Biology, 05.05.2020 21:32
Mathematics, 05.05.2020 21:32
Mathematics, 05.05.2020 21:32


