

Mathematics, 25.12.2019 17:31, abbygailgo674
Ten years ago 53% of american families owned stocks or stock funds. sample data collected by the investment company institute indicate that the percentage is now 46% (the wall street journal, october 5, 2012)
a. develop appropriate hypotheses such that rejection of h0 will support the conclusion that a smaller proportion of american families own stocks or stock funds in 2012 than 10 years ago.
b. assume the investment company institute sampled 300 american families to estimate that the percent owning stocks or stock funds was 46% in 2012. what is the p-value for your hypothesis test?
c. at α = .01, what is your conclusion?

Answers: 2


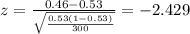

 we have
  so we can conclude that we have enough evidence to reject the null hypothesis, and we can said that at 1% of significance the proportion of American families owning stocks or stock funds is significantly less than 0.53 .
  estimated proportion of American families owning stocks or stock funds
 is the value that we want to test
 represent the p value (variable of interest)
 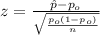 (1)
(1)  is significantly different from a hypothesized value
  .
.


Other questions on the subject: Mathematics
Mathematics, 21.06.2019 19:40, kms275
The cross-sectional areas of a right triangular prism and a right cylinder are congruent. the right triangular prism has a height of 6 units, and the right cylinder has a height of 6 units. which conclusion can be made from the given information? the volume of the triangular prism is half the volume of the cylinder. the volume of the triangular prism is twice the volume of the cylinder. the volume of the triangular prism is equal to the volume of the cylinder. the volume of the triangular prism is not equal to the volume of the cylinder.
Answers: 1
Mathematics, 21.06.2019 19:40, friendsalwaysbae
Given the sequence 7, 14, 28, 56, which expression shown would give the tenth term? a. 7^10 b. 7·2^10 c. 7·2^9
Answers: 1
Mathematics, 21.06.2019 22:00, rhineharttori
Here is my question! jayne is studying urban planning and finds that her town is decreasing in population by 3% each year. the population of her town is changing by a constant rate. true or false?
Answers: 2
Mathematics, 21.06.2019 23:00, abbymoses3
Someone answer this asap for the function f(x) and g(x) are both quadratic functions. f(x) = x² + 2x + 5 g(x) = x² + 2x - 1 which statement best describes the graph of g(x) compared to the graph of f(x)? a. the graph of g(x) is the graph of f(x) shifted down 1 units. b. the graph of g(x) is the graph of f(x) shifted down 6 units. c. the graph of g(x) is the graph of f(x) shifted to the right 1 unit. d. the graph of g(x) is the graph of f(x) shifted tothe right 6 units.
Answers: 3
Do you know the correct answer?
Ten years ago 53% of american families owned stocks or stock funds. sample data collected by the inv...
Questions in other subjects:

Physics, 24.09.2019 14:30

Mathematics, 24.09.2019 14:30
Mathematics, 24.09.2019 14:30

Health, 24.09.2019 14:30
Mathematics, 24.09.2019 14:30

English, 24.09.2019 14:30


