

Mathematics, 21.12.2019 06:31, brutalgitaffe
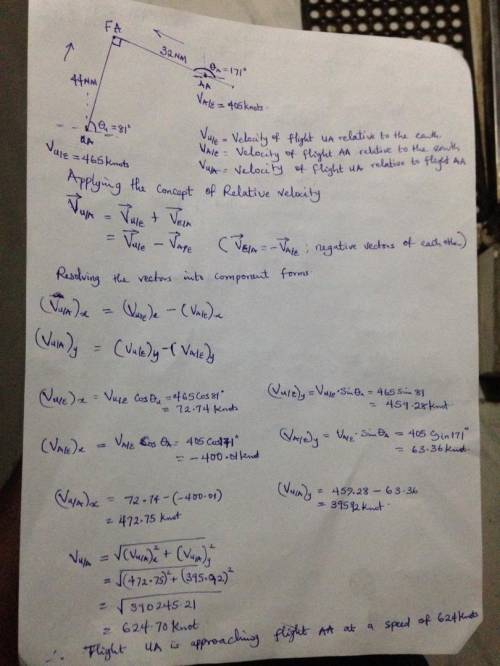
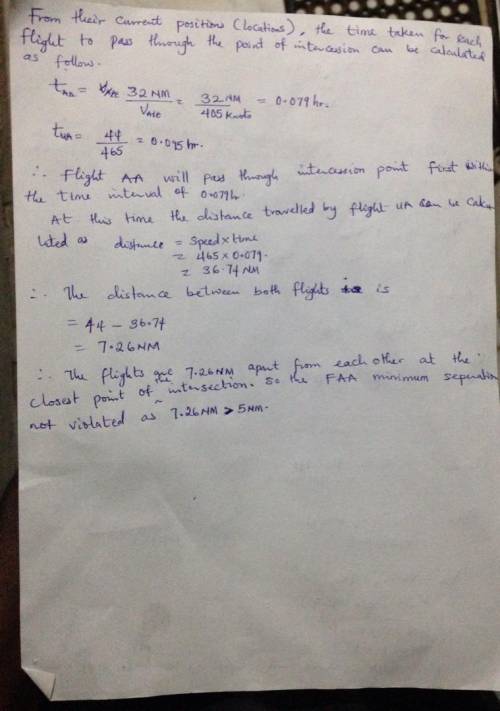
We have been asked to investigate two flights, aa flight and u a flight. both flights are at 33,000 feet, and the flight paths intersect directly over city of frada heights. a committee of concerned citizens has petitioned the city to investigate the possible danger of a collision of these two flights at 1: 30 pm. on the day we checked, we found that at 1: 30 pm , aa was 32 nautical miles from frada heights, approaching it on a heading of 171 degress at a rate of 405 knots. at the same time, united was 44 nautical miles from frada heights and was approaching it on a heading of 81 degrees at a rate of 465 knots. the dps has asked us to determine how fast the planes were approaching each other (i. e., how fast the distance between them was decreasing) at that time. the dps would also like to know whether the flights would have violated the faa's minimum separation requirement of 5 nautical miles. we would like to determine how close the planes actually get to each other.

Answers: 3


Other questions on the subject: Mathematics
Mathematics, 21.06.2019 19:20, alexcarrasco5903
1- is the product of two rational numbers irrational or rational? first, make a hypothesis by multiplying two rational numbers. then, use variables such as x=a/b and y=c/d and the closure property of integers to prove your hypothesis. 2- what do you think the product of a nonzero rational number and an irrational number is? is it rational or irrational? make use of variables, the closure property of integers, and possibly a proof by contradiction to prove your hypothesis. 3- why do we have to specify that the rational number must be nonzero when we determine what the product of a nonzero rational number and an irrational number is? if the rational number were 0, would it give us the same result we found in part b?
Answers: 3
Mathematics, 22.06.2019 01:00, s27511583
The weight of 46 new patients of a clinic from the year 2018 are recorded and listed below. construct a frequency distribution, using 7 classes. then, draw a histogram, a frequency polygon, and an ogive for the data, using the relative information from the frequency table for each of the graphs. describe the shape of the histogram. data set: 130 192 145 97 100 122 210 132 107 95 210 128 193 208 118 196 130 178 187 240 90 126 98 194 115 212 110 225 187 133 220 218 110 104 201 120 183 124 261 270 108 160 203 210 191 180 1) complete the frequency distribution table below (add as many rows as needed): - class limits - class boundaries - midpoint - frequency - cumulative frequency 2) histogram 3) frequency polygon 4) ogive
Answers: 1
Mathematics, 22.06.2019 01:30, ginareyes0423
Awoman who is 64 inches with a shoulder width of 16 inches. write an equation relating the height h to the width w. find the height of a woman who has ashoulder width of 18.5 inches
Answers: 3
Do you know the correct answer?
We have been asked to investigate two flights, aa flight and u a flight. both flights are at 33,000...
Questions in other subjects:

Social Studies, 03.10.2019 01:00

History, 03.10.2019 01:00
Mathematics, 03.10.2019 01:00
Mathematics, 03.10.2019 01:00
Mathematics, 03.10.2019 01:00
Mathematics, 03.10.2019 01:00

Social Studies, 03.10.2019 01:00

Biology, 03.10.2019 01:00


