


Plz !
two ocean beaches are being affected by erosion. the table shows the width, in...

Mathematics, 20.12.2019 11:31, evanwall91
Plz !
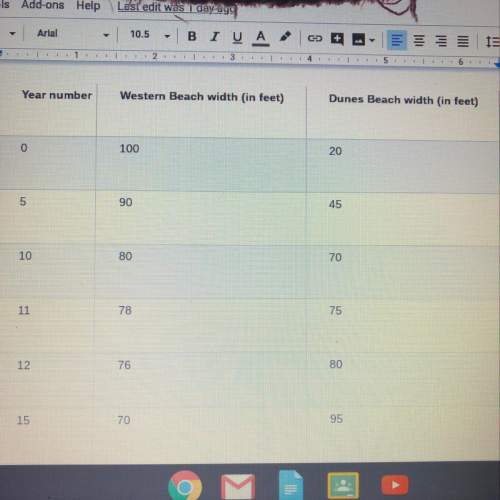
two ocean beaches are being affected by erosion. the table shows the width, in feet, of each beach at high tide measured where 1995 is represented by year 0.
a. describe the pattern shown by the erosion data measurements shown for each of the beaches in the table.
b. between which years will the beaches have a proximately the same width?
c. assuming these rates remain constant, what can you do to get a better approximation of when the two beaches will have the same width?

Answers: 1
Other questions on the subject: Mathematics
Mathematics, 21.06.2019 20:40, vanitycarraway2000
Which table represents points on the graph of h(x) = 3√-x+2?
Answers: 3
Do you know the correct answer?
Questions in other subjects:


English, 18.03.2020 22:04
Mathematics, 18.03.2020 22:04


