
 .
.


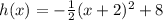
 , where V(h,k) =(-2,8) is the vertex.
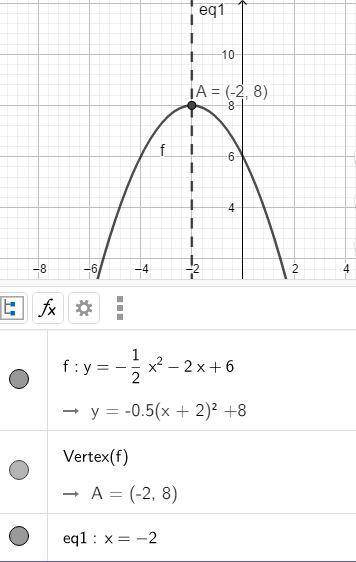


Plot on graph.
plot the axis of symmetry and the point where the maximum value occurs for the f...

Mathematics, 20.12.2019 04:31, mackenziesue8324
Plot on graph.
plot the axis of symmetry and the point where the maximum value occurs for the function below.
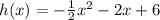
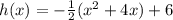
h(x)=-1/2x^2-2x+6

Answers: 3
Other questions on the subject: Mathematics
Mathematics, 22.06.2019 00:10, jocelynfray16
Change negative exponents to positive. then solve. round to four decimal places
Answers: 3
Mathematics, 22.06.2019 01:30, jude40
Asample of 200 rom computer chips was selected on each of 30 consecutive days, and the number of nonconforming chips on each day was as follows: the data has been given so that it can be copied into r as a vector. non. conforming = c(10, 15, 21, 19, 34, 16, 5, 24, 8, 21, 32, 14, 14, 19, 18, 20, 12, 23, 10, 19, 20, 18, 13, 26, 33, 14, 12, 21, 12, 27) #construct a p chart by using the following code. you will need to enter your values for pbar, lcl and ucl. pbar = lcl = ucl = plot(non. conforming/200, ylim = c(0,.5)) abline(h = pbar, lty = 2) abline(h = lcl, lty = 3) abline(h = ucl, lty = 3)
Answers: 3
Do you know the correct answer?
Questions in other subjects:
Mathematics, 26.09.2019 11:50


Mathematics, 26.09.2019 11:50

Advanced Placement (AP), 26.09.2019 11:50

Mathematics, 26.09.2019 11:50


