

Mathematics, 19.12.2019 05:31, maddyr04
The scholastic aptitude test (sat) is a standardized test for college admissions in the u. s. scores on the sat can range from 600 to 2400.
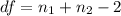
suppose that prepit! is a company that offers classes to students prepare for the sat exam. in their ad, prepit! claims to produce "statistically significant" increases in sat scores. this claim comes from a study in which 427 prepit! students took the sat before and after prepit! classes. these students are compared to 2,733 students who took the sat twice, without any type of formal preparation between tries.
we also conduct a hypothesis test with this data and find that students who retake the sat without prepit! also do significantly better (p-value < 0.0001). so now we want to determine if prepit! students improve more than students who retake the sat without going through the prepit! program. in a hypothesis test, the difference in sample mean improvement ("prepit! gain" minus "control gain") gives a p-value of 0.004. a 90% confidence interval based on this sample difference is 3.0 to 13.0.
what can we conclude?
a. the prepit! claim of statistically significant differences is valid. prepit! classes produce improvements in sat scores that are 3% to 13% higher than improvements seen in the comparison group.
b. compared to the control group, the prepit! course produces statistically significant improvements in sat scores. but the gains are too small to be of practical importance in college admissions.
c. we are 90% confident that between 3% and 13% of students will improve their sat scores after taking prepit! this is not very impressive, as we can see by looking at the small p-value.

Answers: 2
 represent the sample after the preparation
 represent the sample without preparation
  represent the mean sample after preparation
 represent the mean sample without preparation
 represent the sample deviation after preparation
 represent the sample deviation without preparation
 represent the significance level
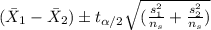 (1)
(1) 
 and
and  , and we can use excel, a calculator or a table to find the critical value. The excel command would be: "=-T.INV(0.025,df)
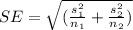


Other questions on the subject: Mathematics
Mathematics, 21.06.2019 15:00, Shavaila18
The data shown in the table below represents the weight, in pounds, of a little girl, recorded each year on her birthday. age (in years) weight (in pounds) 2 32 6 47 7 51 4 40 5 43 3 38 8 60 1 23 part a: create a scatter plot to represent the data shown above. sketch the line of best fit. label at least three specific points on the graph that the line passes through. also include the correct labels on the x-axis and y-axis. part b: algebraically write the equation of the best fit line in slope-intercept form. include all of your calculations in your final answer. part c: use the equation for the line of best fit to approximate the weight of the little girl at an age of 14 years old.
Answers: 3
Mathematics, 21.06.2019 19:00, abraham1366
Which values of p and q result in an equation with exactly one solution? px-43=-42x+q choose all answers that apply: a) p=-43 and q=-43 b) p=42 and q=43 c) p=43 and q=−42 d) p=42 and q=42
Answers: 1
Mathematics, 21.06.2019 20:30, leeshaaa17
Which expression demonstrates the use of the commutative property of addition in the first step of simplifying the expression (-1+i)+(21+5i)+0
Answers: 2
Do you know the correct answer?
The scholastic aptitude test (sat) is a standardized test for college admissions in the u. s. scores...
Questions in other subjects:


Mathematics, 06.03.2020 21:39
Mathematics, 06.03.2020 21:39
Mathematics, 06.03.2020 21:39
Mathematics, 06.03.2020 21:39

Chemistry, 06.03.2020 21:39


