


The graph shows the value of a car at different years after joanna purchased it.
which...

Mathematics, 17.12.2019 01:31, hanjonez
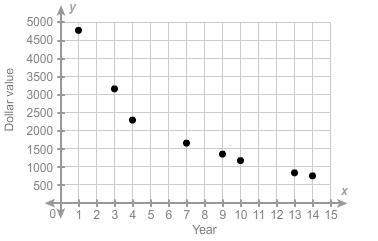
The graph shows the value of a car at different years after joanna purchased it.
which is the best estimate for the average rate of change between year 9 and year 14?
a: –$130/year
b: –$250/year
c: –$75/year
d: –$325/year

Answers: 2
Other questions on the subject: Mathematics
Mathematics, 21.06.2019 19:30, joselinegarciaowyrpf
Asquare picture with sides of 32 inches is to be mounted on a square mat with sides of 52 inches. find the area of the mat that will remain uncovered by the picture.
Answers: 1
Mathematics, 21.06.2019 20:10, lele142018
Which value of m will create a system of parallel lines with no solution? y = mx - 6 8x - 4y = 12
Answers: 3
Do you know the correct answer?
Questions in other subjects:
Mathematics, 17.10.2020 06:01


Advanced Placement (AP), 17.10.2020 06:01
Mathematics, 17.10.2020 06:01

Mathematics, 17.10.2020 06:01

Health, 17.10.2020 06:01


