


Which linear inequality represents the solution set graphed?
a) y < x/2 + 1
<...

Mathematics, 16.12.2019 07:31, Blahdjwj108
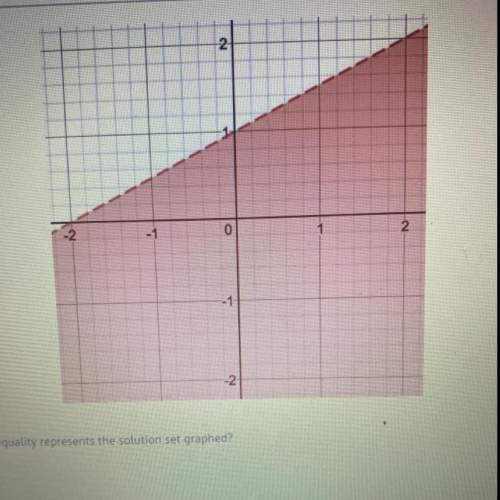
Which linear inequality represents the solution set graphed?
a) y < x/2 + 1
b) y > x/2 + 1
c) y < 2x -2
d) y > 2x - 2

Answers: 2
Other questions on the subject: Mathematics
Mathematics, 22.06.2019 02:50, nataliem02
Triangle dog was rotated to create triangle d'o'g'. describe the transformation using details and degrees.
Answers: 3
Do you know the correct answer?
Questions in other subjects:

English, 28.01.2020 16:56

Health, 28.01.2020 16:56

Chemistry, 28.01.2020 16:56
Mathematics, 28.01.2020 16:56
Mathematics, 28.01.2020 16:56

English, 28.01.2020 16:56


