


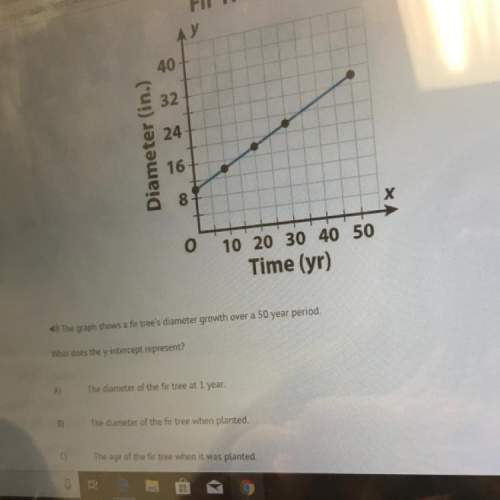
The graph shows a fir tree's diameter growth over a 50 year period.
what does the y-intercept...

Mathematics, 14.12.2019 00:31, pinnky98381
The graph shows a fir tree's diameter growth over a 50 year period.
what does the y-intercept represent?
the diameter of the fir tree at 1 year.
the diameter of the fir tree when planted.
the age of the fir tree when it was planted.
the unit rate for each year of growth.

Answers: 1
Other questions on the subject: Mathematics
Mathematics, 21.06.2019 16:10, DepressionCentral
Which of the following graphs represents the function f(x) = 2^x
Answers: 2
Mathematics, 21.06.2019 22:10, BilliePaul95
Ellen makes and sells bookmarks. she graphs the number of bookmarks sold compared to the total money earned. why is the rate of change for the function graphed to the left?
Answers: 1
Do you know the correct answer?
Questions in other subjects:
Mathematics, 15.01.2021 14:20

Biology, 15.01.2021 14:20

Mathematics, 15.01.2021 14:20

Geography, 15.01.2021 14:20
Mathematics, 15.01.2021 14:20
Mathematics, 15.01.2021 14:20


