


Step 3: making predictions using data
you and your business partner track the number of custo...

Mathematics, 11.12.2019 21:31, sydchann5220
Step 3: making predictions using data
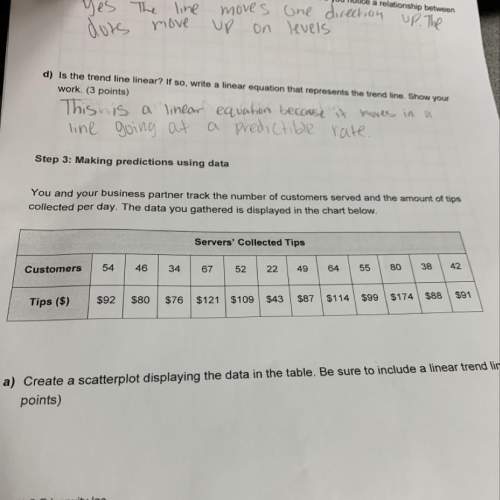
you and your business partner track the number of customers served and the amount of
collected per day. the data you gathered is displayed in the chart below.
servers' collected tips
customers
54
34
67
52
22
49
64
55
80
38
tips ($)
$92
$121 $109
$43
$87 $114 $99 $174 $88
a) create a scatterplot displaying the data in the table. be sure to include a linea
points)

Answers: 1
Other questions on the subject: Mathematics
Mathematics, 20.06.2019 18:04, sajasolo3467
Find the missing part. use an improper fraction for your answer.
Answers: 1
Mathematics, 21.06.2019 20:50, hinsri
The first side of a triangle measures 5 in less than the second side, the third side is 3 in more than the first side, and the perimeter is 17 in. how long is the third side? if s represents the length of the second side, which of the following represents the length of the third side? s-5 ws-2 s+ 3 next question ask for turn it in
Answers: 1
Mathematics, 22.06.2019 00:00, crazylogic963
Charlie is at an amusement park that has 18 different rides. each ride costs $1.75. the function c(r) = 1.75r represents the total amount of money that charlie will spend if he goes on r rides, but he never goes on the same one more than once. what domain and range are reasonable for the function?
Answers: 3
Mathematics, 22.06.2019 01:00, londonchanel
What is the period of the sinusoidal function ?
Answers: 3
Do you know the correct answer?
Questions in other subjects:


Arts, 02.04.2020 16:56

History, 02.04.2020 16:56
Mathematics, 02.04.2020 16:56

History, 02.04.2020 16:57


