
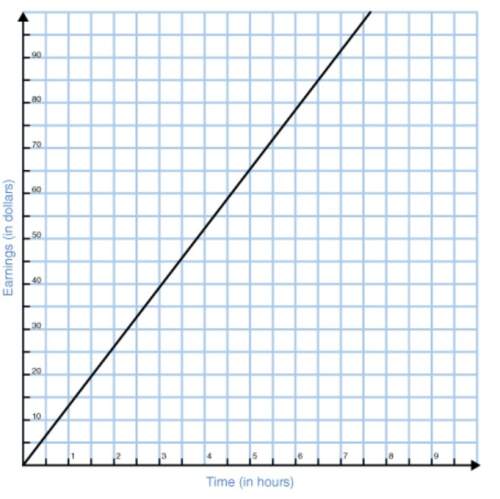


Fiona has to plot a histogram of the given data.
82, 83, 89, 67, 65, 88, 66, 69, 83, 81,...

Mathematics, 07.12.2019 01:31, Leahma327
Fiona has to plot a histogram of the given data.
82, 83, 89, 67, 65, 88, 66, 69, 83, 81, 94, 68, 82, 69, 86, 83, 88, 62, 64, 93
which frequency table should she use for the histogram?
a.
interval 60-70 70-80 80-90 90-100
frequency 8 0 10 2
b.
interval 56-63 63-70 70-77 77-84 84-91 91-98
frequency 1 7 0 5 5 2
c.
interval 50-70 70-80 80-85 85-90 90-100
frequency 8 0 6 4 2
d.
interval 60-75 75-90 90-105
frequency 8 10 2

Answers: 1
Other questions on the subject: Mathematics
Mathematics, 21.06.2019 20:00, whosdarrin9396
If cos(2x) = tan^2(y), show that cos(2y) = tan^2(x).
Answers: 3
Mathematics, 21.06.2019 21:00, kordejah348
Sweet t saved 20 percent of the total cost of the green-eyed fleas new album let there be fleas on earth. if the regular price is $30 how much did sweet save
Answers: 1
Mathematics, 21.06.2019 23:50, lukecarroll19521
What is the cube root of -1,000p^12q3? -10p^4 -10p^4q 10p^4 10p^4q
Answers: 3
Do you know the correct answer?
Questions in other subjects:

English, 21.01.2021 01:00


Physics, 21.01.2021 01:00
Mathematics, 21.01.2021 01:00

Spanish, 21.01.2021 01:00
English, 21.01.2021 01:00
Mathematics, 21.01.2021 01:00


