

Mathematics, 06.12.2019 20:31, nick4524
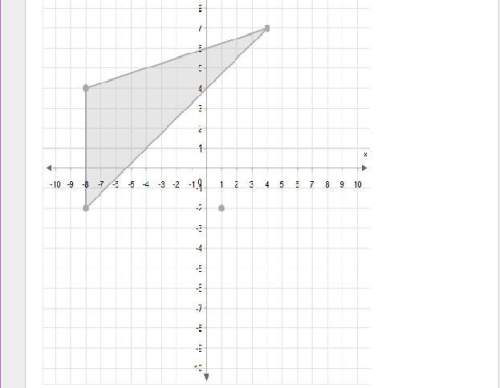
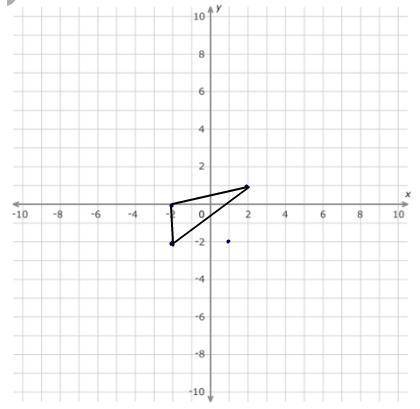
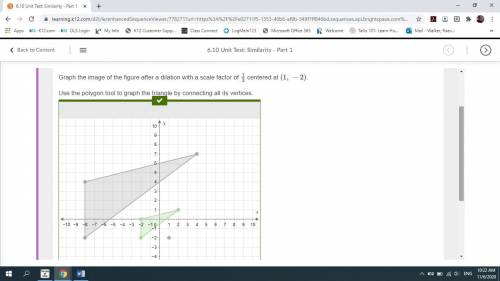
Graph the image of the figure after a dilation with a scale factor of 1/3 centered at (1, −2) . use the polygon tool to graph the triangle by connecting all its vertices.

Answers: 3
![[(4,7)- (1,-2)]*\frac{1}{3} + (1,-2)](/tpl/images/0406/7682/297b2.png)
![[3,9]*\frac{1}{3} +(1,-2)](/tpl/images/0406/7682/1b57b.png)
![[1,3]+(1,-2)= (2,1)](/tpl/images/0406/7682/3d6bd.png)
![[(-8,4)- (1,-2)]*\frac{1}{3} + (1,-2)](/tpl/images/0406/7682/99b79.png)
![[-9,6]*\frac{1}{3} +(1,-2)](/tpl/images/0406/7682/74800.png)
![[-3,2]+(1,-2)= (-2,0)](/tpl/images/0406/7682/79554.png)
![[(-8,-2)- (1,-2)]*\frac{1}{3} + (1,-2)](/tpl/images/0406/7682/aff1a.png)
![[-9,0]*\frac{1}{3} +(1,-2)](/tpl/images/0406/7682/38a83.png)
![[-3,0]+(1,-2)= (-2,-2)](/tpl/images/0406/7682/ebbbb.png)


Other questions on the subject: Mathematics
Mathematics, 21.06.2019 18:30, alizeleach0123
Which representation has a constant of variation of -2.5
Answers: 1
Mathematics, 21.06.2019 20:10, kingdrew27
Acolony contains 1500 bacteria. the population increases at a rate of 115% each hour. if x represents the number of hours elapsed, which function represents the scenario? f(x) = 1500(1.15)" f(x) = 1500(115) f(x) = 1500(2.15) f(x) = 1500(215)
Answers: 3
Mathematics, 21.06.2019 20:30, phamleson8697
Will give let f(x)=2x and g(x)=[tex]2^{x}[/tex] graph the functions on the same coordinate plane. what are the solutions to the equation f(x)=g(x) ? enter your answers in the boxes x=[? ] or x=[? ]
Answers: 1
Do you know the correct answer?
Graph the image of the figure after a dilation with a scale factor of 1/3 centered at (1, −2) . use...
Questions in other subjects:

Biology, 28.06.2020 03:01
Mathematics, 28.06.2020 03:01


