

Mathematics, 23.08.2019 03:40, anthonylopez1
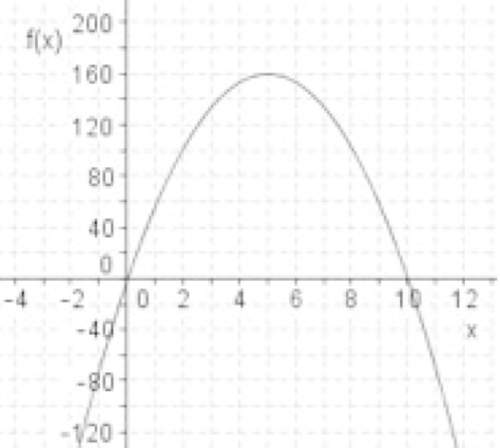
The graph below shows a company's profit f(x), in dollars, depending on the price of pencils x, in dollars, being sold by the company:
graph of quadratic function f of x having x intercepts at ordered pairs negative 0, 0 and 10, 0. the vertex is at 5, 160
part a: what do the x-intercepts and maximum value of the graph represent? what are the intervals where the function is increasing and decreasing, and what do they represent about the sale and profit? (6 points)
part b: what is an approximate average rate of change of the graph from x = 2 to x = 5, and what does this rate represent? (4 points)

Answers: 2


Other questions on the subject: Mathematics
Mathematics, 21.06.2019 19:30, spotty2093
Your food costs are $5,500. your total food sales are $11,000. what percent of your food sales do the food costs represent?
Answers: 2
Mathematics, 21.06.2019 23:00, sandyrose3012
Multiplying fractions by whole number 5 x 1/3=?
Answers: 2
Mathematics, 22.06.2019 04:20, barbar12345
Is an altitude in triangle abc. which statements are true? check all that apply. δabc δbxc δaxc ~ δcxb δbcx δacx δacb ~ δaxc δcxa δcba
Answers: 2
Do you know the correct answer?
The graph below shows a company's profit f(x), in dollars, depending on the price of pencils x, in d...
Questions in other subjects:
Mathematics, 07.10.2019 19:00


Biology, 07.10.2019 19:00


Social Studies, 07.10.2019 19:00
Mathematics, 07.10.2019 19:00


