

Mathematics, 05.12.2019 05:31, abbyhammondd
A2003 study of dreaming found that out of a random sample of 113 people, 35 reported dreaming in color. however, the proportion reported dreaming in color that was established in the 1940s was 0.25. the researcher wants to determine if the proportion of individuals that dream in color has changed since the 1940s. use 0.10 level of significance.
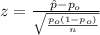
1. what is the normal approximation method appropriate for this test?
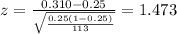
2. compute appropriate test statistic.
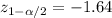
3. at a 0.10 level of significance, what are the critical values for the test.
4. what is the appropriate decision and conclude for the test at 0.10 level of significance (fail to reject, reject ha)
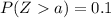
5. would your conclusion change if the test were to be conducted as an upper tailed test? why or why not supporting your answer using the p-value approach.

Answers: 3
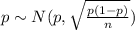


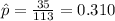 estimated proportion of people reported with dreaming in color
 is the value that we want to test
 represent the significance level
 represent the p value (variable of interest)

 (1)
(1)  is significantly different from a hypothesized value
  .
. and
and  , we need two critical values since we have a bilateral test, we need two values on the normal standard distribution such that:
 . The next step would be calculate the p value for this test.
  so we can conclude that we have enough evidence to FAIL to reject the null hypothesis, and we can said that at 10% of significance, that the proportion of dreaming in color changed from 1940s .


 so we can conclude that we have enough evidence to reject the null hypothesis, and we can said that at 10% of significance, that the proportion of dreaming in coolor is significantly higher from the proportion in 1940s .

Other questions on the subject: Mathematics
Mathematics, 21.06.2019 13:40, NasirKA7372
Use the distance formula to determine the distance that point q is from r on the hypotenusebased on a 2-3 ratio. i need asap !
Answers: 3
Mathematics, 21.06.2019 14:30, chloeozenghar1
Using the given statements, state whether the conditional statement is true or false. p: 7 + 1 = 0 q: 2 + 2 = 5 is p q true or false?
Answers: 1
Do you know the correct answer?
A2003 study of dreaming found that out of a random sample of 113 people, 35 reported dreaming in col...
Questions in other subjects:
Mathematics, 12.11.2019 06:31

English, 12.11.2019 06:31
Mathematics, 12.11.2019 06:31

Mathematics, 12.11.2019 06:31
English, 12.11.2019 06:31

English, 12.11.2019 06:31


