


A. use the regression calculator or another tool of your choice to create a scatter plot of
th...

Mathematics, 02.12.2019 17:31, carelee9449
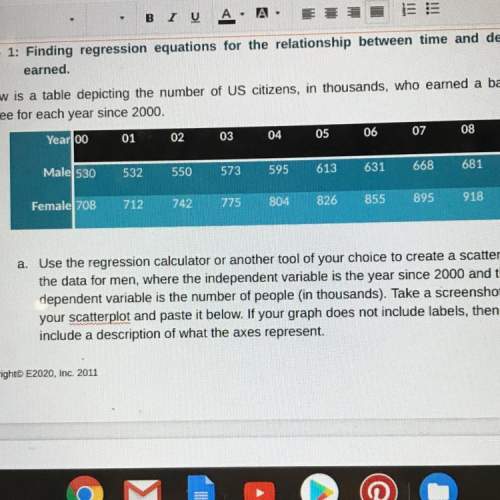
A. use the regression calculator or another tool of your choice to create a scatter plot of
the data for men, where the independent variable is the year since 2000 and the
dependent variable is the number of people in thousands). take a screenshot of
your scatterplot and paste it below. if your graph does not include labels, then
include a description of what the axes represent.

Answers: 2
Other questions on the subject: Mathematics
Mathematics, 21.06.2019 16:30, LiannaMarquez542
Adam plans to choose a video game from the section of the store where everything is 75% off. he writes the expression d-0.75d to find the sale price of the game if the original price is d dollars. gena correctly writes another expression, 0.25d, that will also find the sale price of the game if the original price is d dollars. use the drop down menus to explain each part of adams and rena's expression
Answers: 3
Mathematics, 21.06.2019 19:30, auviannadority13
Equation for the calculation double 2 and then add 5
Answers: 1
Mathematics, 21.06.2019 20:30, alexialiles19
Max recorded the heights of 500 male humans. he found that the heights were normally distributed around a mean of 177 centimeters. which statements about max’s data must be true? a) the median of max’s data is 250 b) more than half of the data points max recorded were 177 centimeters. c) a data point chosen at random is as likely to be above the mean as it is to be below the mean. d) every height within three standard deviations of the mean is equally likely to be chosen if a data point is selected at random.
Answers: 2
Do you know the correct answer?
Questions in other subjects:

Biology, 26.01.2021 20:10
Mathematics, 26.01.2021 20:10


