


Which description best fits the distribution of
the data shown in the histogram?
a)skew...

Mathematics, 25.11.2019 23:31, jaylennkatrina929
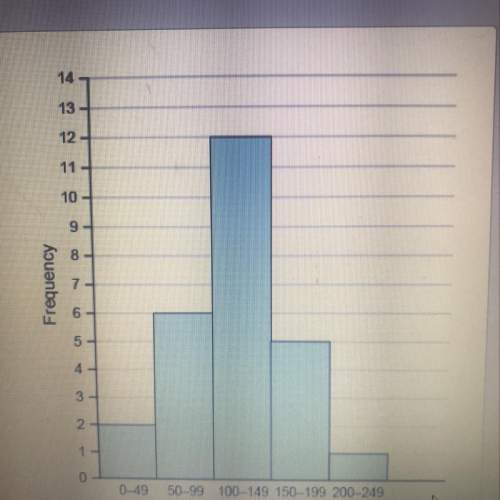
Which description best fits the distribution of
the data shown in the histogram?
a)skewed left
b)skewed right
c)uniform
d)approximately bell-shaped

Answers: 1
Other questions on the subject: Mathematics
Mathematics, 21.06.2019 15:40, jaylene125
Need ! discuss how to convert the standard form of the equation of a circle to the general form. 50 points
Answers: 1
Mathematics, 21.06.2019 19:30, abigailstolp
Find the domain of the following expression: 1/(√x)-2
Answers: 1
Do you know the correct answer?
Questions in other subjects:

History, 15.04.2020 21:23


