


Hello, 100 points to whoever answers the full amount of questions. !
the function a(x...

Mathematics, 25.11.2019 20:31, bailey814
Hello, 100 points to whoever answers the full amount of questions. !
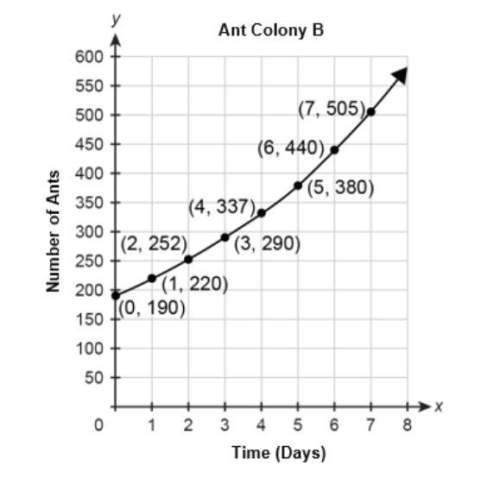
the function a(x) = 210(1.12)x represents the number of ants in ant colony a, x days after an experiment starts. the graph represents the number of ants in ant colony b during the same time period.
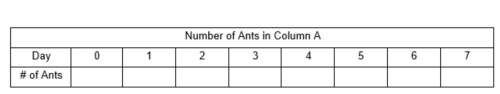
part a.) fill in the chart below for the number of ants in ant colony a each day. round to the nearest whole number. (the chart is the second image.)
part b.) show all your steps to find during week 0, how many more ants are there in ant colony a than in ant colony b?
part c.) show all your steps to find the growth rate of ant colony a.
part d.) show all your steps to find the growth rate of ant colony b.
part e.) use 1-2 complete sentences to compare the growth rate of ant colony a with ant colony b.
part f.) when does the daily number of ants in ant colony b exceed the daily number of ants in ant colony a? explain your answer using 1-2 complete sentences.

Answers: 2
Other questions on the subject: Mathematics
Mathematics, 21.06.2019 15:00, Shavaila18
The data shown in the table below represents the weight, in pounds, of a little girl, recorded each year on her birthday. age (in years) weight (in pounds) 2 32 6 47 7 51 4 40 5 43 3 38 8 60 1 23 part a: create a scatter plot to represent the data shown above. sketch the line of best fit. label at least three specific points on the graph that the line passes through. also include the correct labels on the x-axis and y-axis. part b: algebraically write the equation of the best fit line in slope-intercept form. include all of your calculations in your final answer. part c: use the equation for the line of best fit to approximate the weight of the little girl at an age of 14 years old.
Answers: 3
Mathematics, 21.06.2019 18:00, keasiabrown25
Determine the difference: 3.2 × 10¹⁰ – 1.1 × 10¹⁰. write your answer in scientific notation.
Answers: 1
Mathematics, 21.06.2019 18:00, nativebabydoll35
Two students were asked if they liked to read. is this a good example of a statistical question? why or why not? a yes, this is a good statistical question because a variety of answers are given. b yes, this is a good statistical question because there are not a variety of answers that could be given. c no, this is not a good statistical question because there are not a variety of answers that could be given. no, this is not a good statistical question because there are a variety of answers that could be given
Answers: 1
Do you know the correct answer?
Questions in other subjects:


Social Studies, 27.07.2019 17:50


Geography, 27.07.2019 17:50

Biology, 27.07.2019 17:50


