

Mathematics, 23.11.2019 00:31, lilrariwmb23701
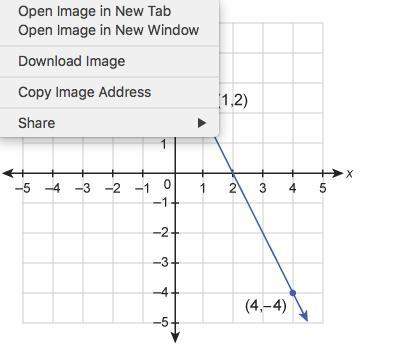
What is the equation of the line shown in this graph? a function graph of a line with two points (1,2) and (4,-4) with an x axis of negative five to five and a y axis of negative five to five drag and drop the expressions to write the equation of the line in slope-intercept form.

Answers: 1


Other questions on the subject: Mathematics
Mathematics, 21.06.2019 15:20, heyrosaphoto3159
The speed of a falling object increases at a constant rate as time increases since the object was dropped. which graph could represent the relationship betweent time in seconds, and s, speed in meters per second? speed of a falling object object over time
Answers: 1
Mathematics, 22.06.2019 00:00, tdahna0403
Which statement explains the relationship between corresponding terms in the table?
Answers: 1
Do you know the correct answer?
What is the equation of the line shown in this graph? a function graph of a line with two points (1...
Questions in other subjects:

Social Studies, 14.10.2020 01:01

History, 14.10.2020 01:01


Biology, 14.10.2020 01:01
History, 14.10.2020 01:01


