


The graph below shows the velocity f(t) of a runner during a certain time interval:
gra...

Mathematics, 16.11.2019 01:31, hana560
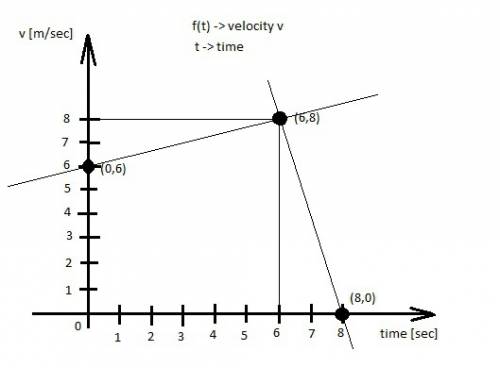
The graph below shows the velocity f(t) of a runner during a certain time interval:
graph of line segment going through ordered pairs 0, 6 and 6, 8. graph of another line segment going through the ordered pairs 6, 8 and 8, 0. label on the x axis is time in seconds and label on the y axis is velocity in meters per second
which of the following describes the intercepts on the graph?
the initial acceleration of the runner was 8 m/s2, and the runner stopped after 6 seconds.
the initial acceleration of the runner was 6 m/s2, and the runner stopped after 8 seconds.
the initial velocity of the runner was 8 m/s, and the runner stopped after 6 seconds.
the initial velocity of the runner was 6 m/s, and the runner stopped after 8 seconds.

Answers: 2
Other questions on the subject: Mathematics
Mathematics, 21.06.2019 14:40, skylerteaker
What is the measure of ac? 5 units 13 units 26 units 39 units
Answers: 3
Mathematics, 21.06.2019 18:30, nina288
Astuntman jumping off a 20-m-high building is modeled by the equation h=20-5t^2, where t is the same in seconds. a high-speed camera is ready to film him between 15m and 10m above the ground. for which interval of time should the camera film him?
Answers: 1
Mathematics, 21.06.2019 18:30, Katlyndavis01
What is the answer to this question? i'm a bit stumped. also how do i do it? 5(x - 4) = 2(x + 5)
Answers: 1
Mathematics, 21.06.2019 22:10, goodygoodgirlygirl
Akitchen is 12 ft. by 14 ft. with 10 ft. high walls. how much would it cost to put vinyl flooring in this room? $8.80 per ft
Answers: 1
Do you know the correct answer?
Questions in other subjects:
Mathematics, 04.03.2021 03:30
Mathematics, 04.03.2021 03:30

World Languages, 04.03.2021 03:30


Mathematics, 04.03.2021 03:30


Advanced Placement (AP), 04.03.2021 03:30


