

Mathematics, 19.11.2019 03:31, ushayuri
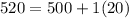
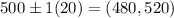
Wood shipping boxes are often recommended over cardboard shipping boxes because its strength tends to be higher, therefore, making it more durable and long-lasting. based on data collected, fedex determines that the breaking strength of most wooden shipping boxes are normally distributed with a mean of 500 pounds per square inch and a standard deviation of 20 pounds per square inch. based on the 68-95-99.7 rule, about what percent of its wooden shipping boxes will have breaking strengths greater than 520 pounds per square inch

Answers: 1
 About 95% of the data lies within the first two standard deviations that is
  About 99.7% of the data lies within the first three standard deviations that is


Other questions on the subject: Mathematics
Mathematics, 21.06.2019 16:00, kell22wolf
Part one: measurements 1. measure your own height and arm span (from finger-tip to finger-tip) in inches. you will likely need some from a parent, guardian, or sibling to get accurate measurements. record your measurements on the "data record" document. use the "data record" to you complete part two of this project. name relationship to student x height in inches y arm span in inches archie dad 72 72 ginelle mom 65 66 sarah sister 64 65 meleah sister 66 3/4 67 rachel sister 53 1/2 53 emily auntie 66 1/2 66 hannah myself 66 1/2 69 part two: representation of data with plots 1. using graphing software of your choice, create a scatter plot of your data. predict the line of best fit, and sketch it on your graph. part three: the line of best fit include your scatter plot and the answers to the following questions in your word processing document 1. 1. which variable did you plot on the x-axis, and which variable did you plot on the y-axis? explain why you assigned the variables in that way. 2. write the equation of the line of best fit using the slope-intercept formula $y = mx + b$. show all your work, including the points used to determine the slope and how the equation was determined. 3. what does the slope of the line represent within the context of your graph? what does the y-intercept represent? 5. use the line of best fit to you to describe the data correlation.
Answers: 2
Mathematics, 21.06.2019 21:30, theoretical0315
Julie goes to the sports store and spends $40.50 before tax. she buys a pair of shorts for $21.75 and 3 pairs of socks that each cost the same amount. how much does each pair of socks cost? $$
Answers: 1
Mathematics, 21.06.2019 23:00, koryhudson8124
How many heads would you expect if you flipped a coin twice? first, fill in the table below with the correct probabilities. hint: the sample space for flipping a coin twice is {hh, ht, th, tt}. a = b = c = f
Answers: 1
Do you know the correct answer?
Wood shipping boxes are often recommended over cardboard shipping boxes because its strength tends t...
Questions in other subjects:

Social Studies, 05.10.2019 09:30

English, 05.10.2019 09:30
Mathematics, 05.10.2019 09:30

History, 05.10.2019 09:30


