

Mathematics, 19.11.2019 00:31, Bangggggg6
Ialready know the answer but i need someone to explain to me how to get the answer. you get 50 points
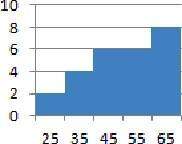
in a survey, 26 voters were asked their ages. the results are shown below. given a lower class limit of 20 and a class width of 10, which histogram correctly represents the data?
43 56 28 63 67 66 52 48 37 51 40 60 62 66 45 21 35 49 32 53 61 53 69 31 48 59
(see attachments for answers)

Answers: 1


Other questions on the subject: Mathematics
Mathematics, 21.06.2019 17:20, tinyiaihfurlow
Match the equivalent expressions. x - 3y + 12 12 - 3y - 2x + x + 2x 3x + 2y - 2x + y + 12 3y + 12 3x + y - 12 4y + 3y + 3x - 6y - 10 - 2 x + 3y + 2x - 3x + 7 + 5 x + 3y + 12 5 + 2y + 7x - 4x + 3y - 17
Answers: 1
Do you know the correct answer?
Ialready know the answer but i need someone to explain to me how to get the answer. you get 50 point...
Questions in other subjects:


Biology, 25.10.2019 13:43


Advanced Placement (AP), 25.10.2019 13:43

Chemistry, 25.10.2019 13:43


Business, 25.10.2019 13:43

English, 25.10.2019 13:43


