


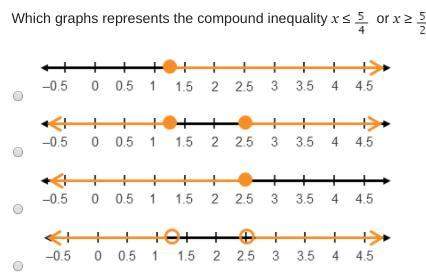
Which graphs represents the compound inequality x ≤ 5/4 or x ≥5/4 ?
...

Mathematics, 14.11.2019 21:31, zemathes
Which graphs represents the compound inequality x ≤ 5/4 or x ≥5/4 ?

Answers: 2
Other questions on the subject: Mathematics
Mathematics, 21.06.2019 13:20, alexishenning
Using the graph below, select all statements that are true. a. f(0.6)=0 b. f(-3.2)=-3 c. f(5.1)=5 d. this is the graph of the greatest integer function. e. this graph is one-to-one.
Answers: 1
Mathematics, 21.06.2019 16:00, ctyrector
Asap for seven months an ice creams vendor collects data showing the number of cones sold a day (c) and the degrees above 70 degrees f the vendor finds that there is a positive linear association between c and t that is the best modeled by this equation c=3.7t+98 which statement is true? the model predicts that the average number of cones sold in a day is 3.7 the model predicts that the average number of cones sold i a day is 98 a model predicts that for each additional degree that the high temperature is above 70 degres f the total of number of cones sold increases by 3.7 the model predicts for each additional degree that the high temperature is above 70 degrees f the total number of cones sold increasingly by 98
Answers: 3
Mathematics, 21.06.2019 17:30, rosie20052019
One positive number is 9 more than twice another. if their product is 95, find the numbers
Answers: 1
Mathematics, 21.06.2019 19:50, keigleyhannah30
Use composition to determine if (x) or h(x) is the inverse of f(x) for the limited domain x2-1.
Answers: 3
Do you know the correct answer?
Questions in other subjects:

Mathematics, 30.06.2021 02:50
Mathematics, 30.06.2021 02:50


