Mathematics, 05.11.2019 04:31, 19zmurphy
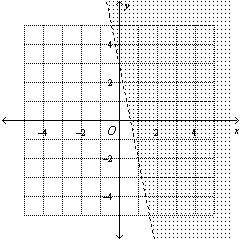
Choose the linear inequality that describes each graph.
y > – 5x + 3
y > – 5x – 3
y < – 5x + 3
y > – 3x + 5


Answers: 3
Other questions on the subject: Mathematics

Mathematics, 21.06.2019 14:00, anthonyjackson12aj
Select the best attribute for the angle pair formed by two parallel lines intersected by a transversal.
Answers: 2

Mathematics, 21.06.2019 22:20, skyhighozzie
(b) suppose that consolidated power decides to use a level of significance of α = .05, and suppose a random sample of 100 temperature readings is obtained. if the sample mean of the 100 temperature readings is x⎯⎯ = 60.990, test h0 versus ha and determine whether the power plant should be shut down and the cooling system repaired. perform the hypothesis test by using a critical value and a p-value. assume σ = 5. (round your z to 2 decimal places and p-value to 4 decimal places.)
Answers: 2

Mathematics, 22.06.2019 00:10, electrofy456
Which polygon is she in the process of constructing ?
Answers: 1
Do you know the correct answer?
Choose the linear inequality that describes each graph.
y > – 5x + 3
y &...
y > – 5x + 3
y &...
Questions in other subjects:


Geography, 27.06.2019 01:30

Mathematics, 27.06.2019 01:30


![[0, 3],](/tpl/images/0359/9960/32614.png) you do
you do  by either moving five blocks north over one block west or five blocks south over one block east [west and south are negatives], then you shade everything to the right of the line because using the zero-interval test, also known as the test point [origin], we can determine what side of a line to shade. This is done by plugging "0" in for both y and x, then determining whether false or true will tell you which side to shade. In this case, we shade to the right of the line because when we plug the test point into the function, we get this false statement:


