Mathematics, 03.11.2019 10:31, jungcoochie101
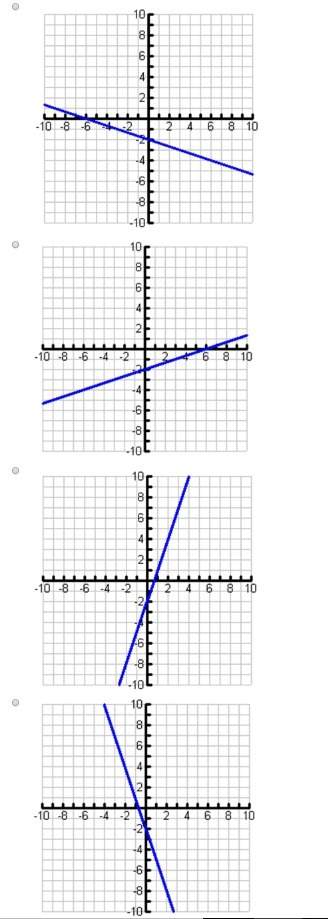
At a basketball camp, the players were randomly divided into different groups. the number of players in each group varied. the assistant manager of the basketball camp drew the scatter plot below to record the number of baskets the different groups of players made in a 5-minute shooting drill. part a: explain whether or not the line given in the graph is the line of best fit for the data. if it is not the line of best fit, explain what needs to be done to the line to make it the best line of fit for the data. part b: write an equation for the line of best fit.

Answers: 2
Other questions on the subject: Mathematics

Mathematics, 21.06.2019 18:00, ineedhelp2285
Yesterday i ran 5 miles. today, i ran 3.7 miles. did my percent increase, decrease or is it a percent error? plz i need
Answers: 2

Mathematics, 21.06.2019 20:00, karamalqussiri478
The weight v of an object on venus varies directly with its weight e on earth. a person weighing 120 lb on earth would weigh 106 lb on venus. how much would a person weighing 150 lb on earth weigh on venus?
Answers: 1

Do you know the correct answer?
At a basketball camp, the players were randomly divided into different groups. the number of players...
Questions in other subjects:


Mathematics, 02.02.2020 21:47

Mathematics, 02.02.2020 21:47


History, 02.02.2020 21:47


History, 02.02.2020 21:47

English, 02.02.2020 21:47

Mathematics, 02.02.2020 21:47


