

Mathematics, 30.10.2019 00:31, TrueKing184
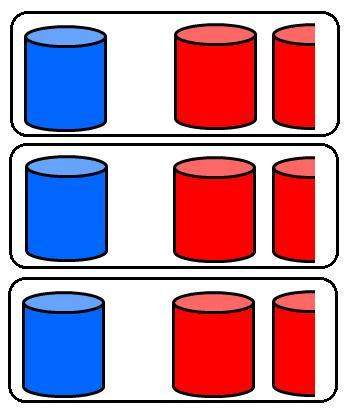
The diagram below shows the relationship between the number of blue paint cans and red paint cans needed for an art project.
based on the diagram, what is the unit rate for this project?
a.
1.5 blue cans per red can
b.
1.5 red cans per blue can
c.
2.5 blue cans per red can
d.
2.5 red cans per blue can

Answers: 3


Other questions on the subject: Mathematics
Mathematics, 21.06.2019 18:30, perezsamantha3oqr0za
(05.08a)triangle abc is transformed to similar triangle a′b′c′ below: a coordinate plane is shown. triangle abc has vertices a at 2 comma 6, b at 2 comma 4, and c at 4 comma 4. triangle a prime b prime c prime has vertices a prime at 1 comma 3, b prime at 1 comma 2, and c prime at 2 comma 2. what is the scale factor of dilation? 1 over 2 1 over 3 1 over 4 1 over 5
Answers: 3
Mathematics, 21.06.2019 19:50, jlankford148
A3-dimensional figure has a square base and 4 lateral faces that meet at a point. explain the difference between the cross sections when a slice is made perpendicular to the base through the vertex, and when a slice is made perpendicular to the base and not through the vertex
Answers: 2
Do you know the correct answer?
The diagram below shows the relationship between the number of blue paint cans and red paint cans ne...
Questions in other subjects:
Mathematics, 08.10.2020 23:01
Mathematics, 08.10.2020 23:01


History, 08.10.2020 23:01


Mathematics, 08.10.2020 23:01


