


The descriptive statistics are shown.
analyzing misleading graphs and reports
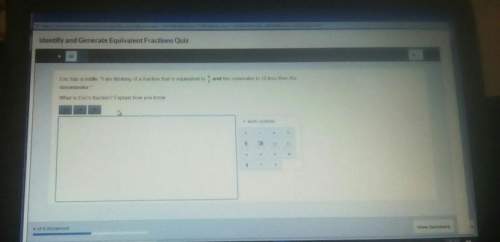
comp...

Mathematics, 10.10.2019 00:10, Joesefsky
The descriptive statistics are shown.
analyzing misleading graphs and reports
compare the measures. describe what these measures indicate about the shape of the box-and-whisker plot.

Answers: 1
Other questions on the subject: Mathematics
Mathematics, 21.06.2019 16:00, blackwhiteroses383
Which graph represents the solution set for the given system of inequalities? x+2y< 3 x+y> 4 3x-2y> 4
Answers: 2
Mathematics, 21.06.2019 18:30, jwagner1580
Complex numbers multiply √-4 * √-25 and show all intermediate steps. alternative notation is sqrt(-4) * sqrt(-25).
Answers: 1
Mathematics, 21.06.2019 21:20, aaronroberson4940
Find the least common denominator for thesetvo rational expressions. n^2/n^2+4n+4 -3/n^2+7n+10
Answers: 2
Do you know the correct answer?
Questions in other subjects:


Mathematics, 22.10.2020 16:01
Mathematics, 22.10.2020 16:01


