

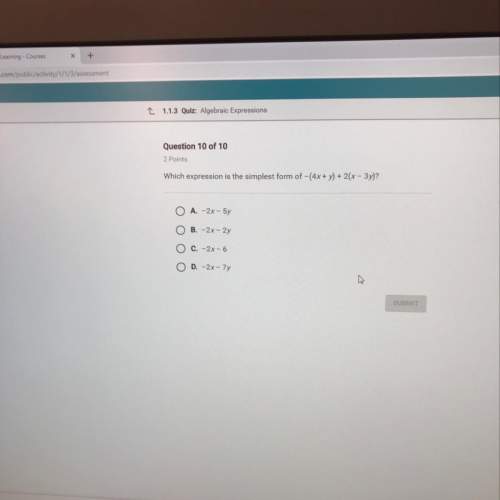
Mathematics, 09.10.2019 18:30, genyjoannerubiera
Two functions are defined as shown. f(x) = f(x) equals negative startfraction 1 over 2 endfraction x minus 2. x – 2 g(x) = –1 which graph shows the input value for which f(x) = g(x)?

Answers: 2


Other questions on the subject: Mathematics
Mathematics, 21.06.2019 20:00, tansebas1107
Can you me find the missing length. i attached an image.
Answers: 1
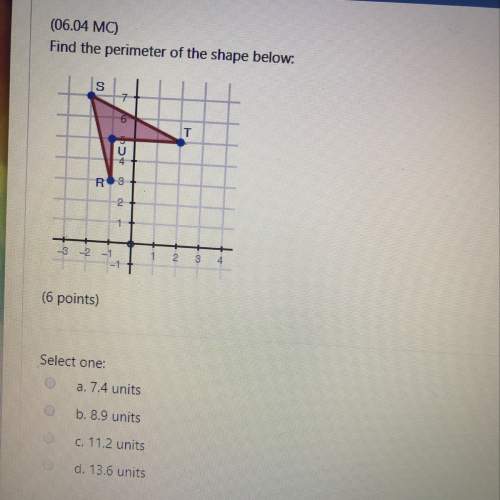
Mathematics, 22.06.2019 00:00, girlieredc
Apolygon is shown on the graph: a polygon is shown on the coordinate plane. vertices are located at 3 comma 5, 1 comma 3, 1 comma 1, 2 comma 0, 4 comma 0, 5 comma 1, and 5 comma 3. what effect will a translation 3 units down and 2 units left have on the polygon? be sure to address how it could impact the angles, side lengths, and congruency between the original pre-image and the image. xd i need
Answers: 3
Mathematics, 22.06.2019 01:30, venny23
The unpaid balance on a mastercard charge was $1,056.23. during the month, payments of $300 and $250 were made and charges of $425 and $274.16 were added. if the finance charge is 1.2% per month on the unpaid balance, find the new balance at the end of the month. $1,205.39 $1,218.06 $918.06 $1,768.06
Answers: 2
Mathematics, 22.06.2019 03:00, trixxytang
Isabelle is mixing red and blue paint to make purple paint she adds 3/10 of a fluid ounce of red to 12/25 of a fluid ounce of blue to make 1 1/30 fluid ounces of purple how many fluid ounces of red paint ounces of red paint will she need to make 3 fluid ounces of purple paint
Answers: 1
Do you know the correct answer?
Two functions are defined as shown. f(x) = f(x) equals negative startfraction 1 over 2 endfraction x...
Questions in other subjects:


Physics, 12.04.2020 07:08


