

Mathematics, 07.10.2019 20:20, burners
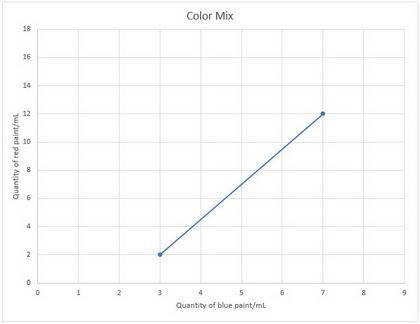
Eira created color panels for a wall using a mix of only red and blue paints. she plotted the quantities of red and blue paints used for each mix and connected them using a line segment, as shown in the graph below:
a line graph titled color mix, with quantity of blue paint, in millimeters, on the x axis and quantity of red paint, in millimeters, on the y axis. the x axis has a scale from 0 to 9 with an increment of 1. the y axis has a scale of 0 to 18 in increments of 2. a straight line connecting 3, 2 and 7, 12 is drawn.
which statement best describes the domain of the function represented in the graph? (1 point)
3 ≤ x ≤ 12 or x is between 3 and 12, inclusive
3 ≤ x ≤ 7 or x is between 3 and 7, inclusive
2 ≤ x ≤ 12 or x is between 2 and 12, inclusive
2 ≤ x ≤ 7 or x is between 2 and 7, inclusive

Answers: 1


Other questions on the subject: Mathematics
Mathematics, 21.06.2019 13:00, masonbitterman7488
Mary had at least an 80% on her test write an inequality to represent this situation
Answers: 2
Mathematics, 21.06.2019 16:30, danielmurillo28
If c(x) = 4x – 2 and d(x) = x2 + 5x, what is (cxd)(x)
Answers: 2
Mathematics, 21.06.2019 21:40, Blakemiller2020
Which of the following best describes the graph below? + + 2 + 3 + 4 1 o a. it is not a function. o b. it is a one-to-one function. o c. it is a many-to-one function. o d. it is a function, but it is not one-to-one.
Answers: 3
Do you know the correct answer?
Eira created color panels for a wall using a mix of only red and blue paints. she plotted the quanti...
Questions in other subjects:

History, 19.12.2019 00:31

Mathematics, 19.12.2019 00:31


