


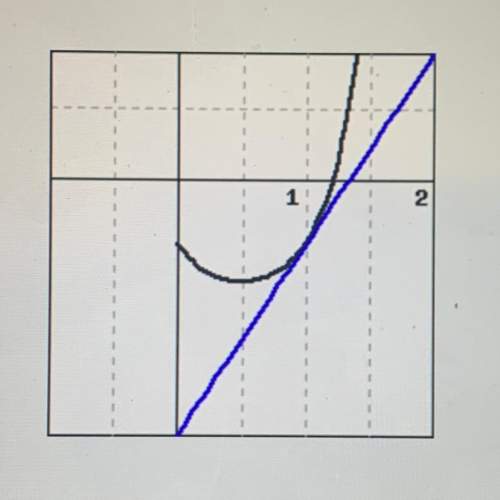
The figure below shows f(x) and its local linearization at x = a, y = 3x - 4. (the local
linea...

Mathematics, 07.10.2019 06:30, andrwisawesome0
The figure below shows f(x) and its local linearization at x = a, y = 3x - 4. (the local
linearization is shown in blue.)
what is the value of a?
a=
what is the value of f(a)?
f(a) =
use the linearization to approximate the value of f(1.2).
f(1.2) =
is the approximation an under-or overestimate?
(enter under or over.)

Answers: 2
Other questions on the subject: Mathematics
Mathematics, 21.06.2019 16:30, victoria8281
Answer the following for 896.31 cm= km 100cm = 1m 1000m = 1km a) 0.0089631 b) 0.0089631 c) 8.9631 d) 89.631
Answers: 1
Mathematics, 21.06.2019 20:00, duhitzmay4693
The scatterplot below shows the number of hours that students read weekly and the number of hours that they spend on chores weekly. which statement about the scatterplot is true?
Answers: 2
Do you know the correct answer?
Questions in other subjects:

Business, 16.06.2020 22:57


Physics, 16.06.2020 22:57
Mathematics, 16.06.2020 22:57

Mathematics, 16.06.2020 22:57
Mathematics, 16.06.2020 22:57
Mathematics, 16.06.2020 22:57


