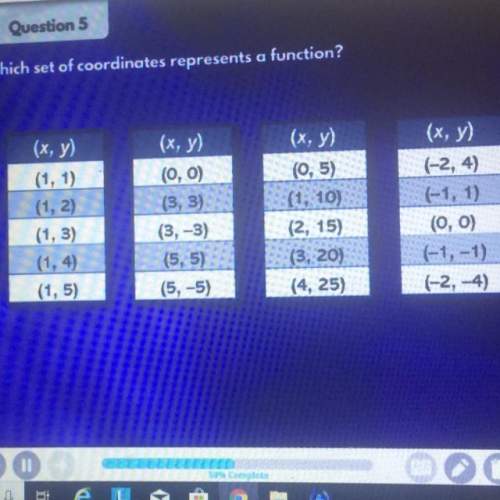
Which graph shows a set of ordered pairs that represent a function?
on a coordinate pla...

Mathematics, 03.10.2019 11:30, baseballdude4807
Which graph shows a set of ordered pairs that represent a function?
on a coordinate plane, solid circles appear at the following points: (negative 2, 3), (negative 1, 2), (1, 1), (2, negative 1), (2, negative 3), (4, negative 5).
on a coordinate plane, solid circles appear at the following points: (negative 4, negative 4), (negative 2, 2), (1, 1), (2, negative 5), (4, negative 3), (4, 4).
on a coordinate plane, solid circles appear at the following points: (negative 3, 2), (negative 2, 2), (0, 1), (1, 3), (2, negative 4), (4, negative 1).
on a coordinate plane, solid circles appear at the following points: (negative 4, 2), (negative 2, 1), (negative 2, negative 1), (0, negative 2), (0, negative 4), (2, negative 5).

Answers: 2
Other questions on the subject: Mathematics

Mathematics, 21.06.2019 18:20, julieariscar769
Inez has a phone card. the graph shows the number of minutes that remain on her phone card a certain number of days.
Answers: 2

Mathematics, 21.06.2019 20:30, Gabyngreen
What is the interquartile range of this data set? 2, 5, 9, 11, 18, 30, 42, 48, 55, 73, 81
Answers: 1

Mathematics, 21.06.2019 21:30, vaelriacb5317
Is triangle jkl congruent to triangle rst? if so, what is the scale factor?
Answers: 1
Do you know the correct answer?
Questions in other subjects:

History, 23.04.2021 17:00


Mathematics, 23.04.2021 17:00

Mathematics, 23.04.2021 17:00

Chemistry, 23.04.2021 17:00

Mathematics, 23.04.2021 17:00

Mathematics, 23.04.2021 17:00


 and
and  . So, this is not a function because there is ambiguity defining
  . Should it be
  or
or  ?
? and
and  . So, this is not a function because there is ambiguity defining
  . Should it be
  or
or  ?
?
 and
and  . So, this is not a function because there is ambiguity defining
  . Should it be
  or
or  ?
?


