


The bar graph shows the average number of
years a group of people devoted to their
most...

Mathematics, 03.10.2019 10:30, eweqwoewoji
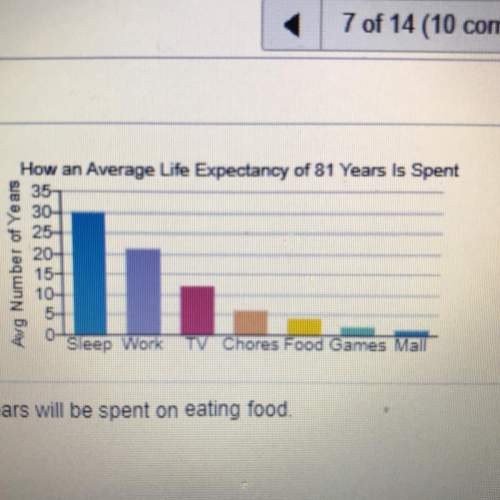
The bar graph shows the average number of
years a group of people devoted to their
most time-consuming activities. according to
the graph, a person from this group will
devote 25 years to working and eating food.
the number of years working will exceed the
number of years eating food by 17. over a
lifetime, how many years will be spent on
each of these activities?

Answers: 2
Other questions on the subject: Mathematics
Mathematics, 21.06.2019 23:50, trippie4life
Determine the area of a triangle with (see picture below)
Answers: 1
Mathematics, 22.06.2019 00:30, cassidyhead27
A10 inch cookie cake is divided into 8 slices. what is the area of 3 slices
Answers: 1
Do you know the correct answer?
Questions in other subjects:


Arts, 16.07.2020 17:01
Mathematics, 16.07.2020 17:01

Mathematics, 16.07.2020 17:01


