

Mathematics, 03.10.2019 09:30, Franklyn3220
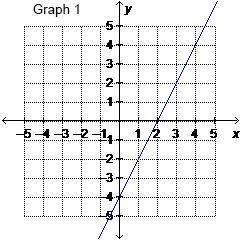
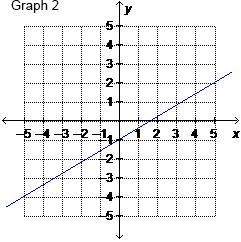
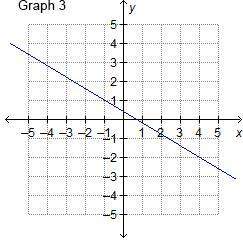
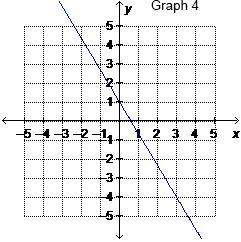
The line represented by the equation 3x + 5y = 2 has a slope of -3/5. which shows the graph of this equation?
answer asap

Answers: 1


Other questions on the subject: Mathematics
Mathematics, 21.06.2019 18:30, FailingstudentXD
Do some research and find a city that has experienced population growth. determine its population on january 1st of a certain year. write an exponential function to represent the city’s population, y, based on the number of years that pass, x after a period of exponential growth. describe the variables and numbers that you used in your equation.
Answers: 3
Mathematics, 21.06.2019 21:30, lainnn974
Questions 7-8. use the following table to answer. year 2006 2007 2008 2009 2010 2011 2012 2013 cpi 201.6 207.342 215.303 214.537 218.056 224.939 229.594 232.957 7. suppose you bought a house in 2006 for $120,000. use the table above to calculate the 2013 value adjusted for inflation. (round to the nearest whole number) 8. suppose you bought a house in 2013 for $90,000. use the table above to calculate the 2006 value adjusted for inflation. (round to the nearest whole number)
Answers: 3
Mathematics, 21.06.2019 22:10, leslie4759
Which function can be used to model the monthly profit for x trinkets produced? f(x) = –4(x – 50)(x – 250) f(x) = (x – 50)(x – 250) f(x) = 28(x + 50)(x + 250) f(x) = (x + 50)(x + 250)
Answers: 2
Do you know the correct answer?
The line represented by the equation 3x + 5y = 2 has a slope of -3/5. which shows the graph of this...
Questions in other subjects:

Chemistry, 20.11.2020 02:20

English, 20.11.2020 02:20
Mathematics, 20.11.2020 02:20
English, 20.11.2020 02:20
Mathematics, 20.11.2020 02:20


