


question 3
plot a graph of height vs age given the data below.
age = (10, 12...

Mathematics, 03.10.2019 01:00, georgesarkes12
question 3
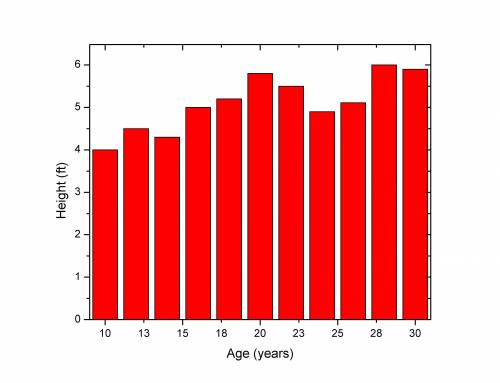
plot a graph of height vs age given the data below.
age = (10, 12, 14, 16, 18, 20, 22, 24, 26, 28, 30)
height = (4, 4.5, 4.3, 5, 5.2, 5.8, 5.5, 4.9, 5.11, 6, 5.9)
label the axis and chart. age is the x-axis and height the y-axis.
hint: use square brackets when assigning values to variables.

Answers: 3
Other questions on the subject: Mathematics
Mathematics, 21.06.2019 22:10, Jenifermorales101
Write the function for the graph. (1.8) (0,4)
Answers: 3
Mathematics, 21.06.2019 23:00, Ellafrederick
Janie has $3. she earns $1.20 for each chore she does and can do fractions of chores. she wants to earn enough money to buy a cd for $13.50.
Answers: 2
Mathematics, 21.06.2019 23:00, lejeanjamespete1
Graph the system of equations. {6x−4y=−244x−8y=−32 use the line tool to graph the lines.
Answers: 1
Do you know the correct answer?
Questions in other subjects:
Mathematics, 26.02.2021 07:30
Mathematics, 26.02.2021 07:30
Mathematics, 26.02.2021 07:30

History, 26.02.2021 07:30


Business, 26.02.2021 07:30
Mathematics, 26.02.2021 07:30


