

Mathematics, 02.10.2019 16:20, sksksjs
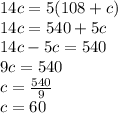
The superintendent of highways is further interested in the numbers of commercial vehicles that frequently use the county’s highways. he obtains information from the department of motor vehicles for the month of september and finds that for every 14 non-commercial vehicles, there were 5 commercial vehicles. if there were 108 more non-commercial vehicles than commercial vehicles, how many of each type of vehicle frequently use the county’s highways during the month of september?

Answers: 1


Other questions on the subject: Mathematics
Mathematics, 21.06.2019 19:00, AbhiramAkella
You earn a 12% commission for every car you sell. how much is your commission if you sell a $23,000 car?
Answers: 1
Mathematics, 22.06.2019 01:00, dyllanmasters99
Determine the intercepts of the line that passes through the following points. (15,-3)(15,−3) (20,-5)(20,−5) (25,-7)(25,−7)
Answers: 1
Mathematics, 22.06.2019 03:00, dominiqueallen23
Describe how the presence of possible outliers might be identified on the following. (a) histograms gap between the first bar and the rest of bars or between the last bar and the rest of bars large group of bars to the left or right of a gap higher center bar than surrounding bars gap around the center of the histogram higher far left or right bar than surrounding bars (b) dotplots large gap around the center of the data large gap between data on the far left side or the far right side and the rest of the data large groups of data to the left or right of a gap large group of data in the center of the dotplot large group of data on the left or right of the dotplot (c) stem-and-leaf displays several empty stems in the center of the stem-and-leaf display large group of data in stems on one of the far sides of the stem-and-leaf display large group of data near a gap several empty stems after stem including the lowest values or before stem including the highest values large group of data in the center stems (d) box-and-whisker plots data within the fences placed at q1 â’ 1.5(iqr) and at q3 + 1.5(iqr) data beyond the fences placed at q1 â’ 2(iqr) and at q3 + 2(iqr) data within the fences placed at q1 â’ 2(iqr) and at q3 + 2(iqr) data beyond the fences placed at q1 â’ 1.5(iqr) and at q3 + 1.5(iqr) data beyond the fences placed at q1 â’ 1(iqr) and at q3 + 1(iqr)
Answers: 1
Do you know the correct answer?
The superintendent of highways is further interested in the numbers of commercial vehicles that freq...
Questions in other subjects:


History, 08.12.2020 02:00


Mathematics, 08.12.2020 02:00

Social Studies, 08.12.2020 02:00


