

Mathematics, 30.09.2019 04:10, syd5723
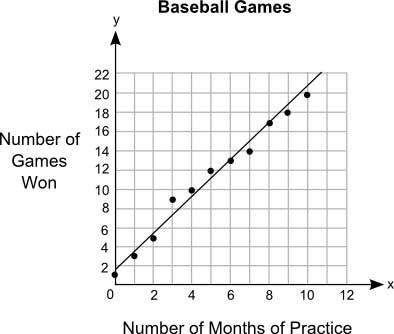
the graph shows the relationship between the number of months different students practiced baseball and the number of games they won:
the title of the graph is baseball games. on x axis, the label is number of months of practice. on y axis, the label is number of games won. the scale on the y axis is from 0 to 22 at increments of 2, and the scale on the x axis is from 0 to 12 at increments of 2. the points plotted on the graph are the ordered pairs 0, 1 and 1, 3 and 2, 5 and 3, 9 and 4, 10 and 5, 12 and 6, 13 and 7, 14 and 8,17 and 9, 18 and 10,20. a straight line is drawn joining the ordered pairs 0, 1.8 and 2, 5.6 and 4, 9.2 and 6, 13 and 8, 16.5 and 10, 20.5.
part b: write the equation for the line of best fit in slope-intercept form and use it to predict the number of games that could be won after 13 months of practice. show your work and include the points used to calculate the slope. (5 points)
my answer is y = mx + b
y = (7/4) multiplied by 13 + 3
the answer would be 26.
what points should i use to find the slope?

Answers: 1


Other questions on the subject: Mathematics
Mathematics, 20.06.2019 18:04, datgamer13
Multiply. −2x(6x4−7x2+x−5) express the answer in standard form. enter your answer in the box.
Answers: 2
Do you know the correct answer?
the graph shows the relationship between the number of months different students practiced baseball...
Questions in other subjects:


History, 19.04.2021 23:10
History, 19.04.2021 23:10
Mathematics, 19.04.2021 23:10

English, 19.04.2021 23:10

Physics, 19.04.2021 23:10


