

Mathematics, 25.09.2019 17:30, plssshelp
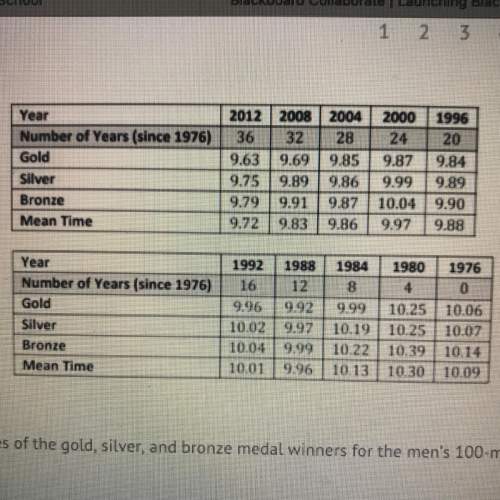
The table shows the times of the gold, silver, and bronze medal winners for the men's 100-meter race (in seconds) for 10
olympic games.
using the data points for 1992 and 2004, what is the best interpretation of the y-intercept in context of this problem?

Answers: 1


Other questions on the subject: Mathematics
Mathematics, 21.06.2019 21:30, bryantfoster
Helll ! 1,400 tons of wheat of two different varieties was delivered to the silo. when processing one variety, there was 2% of waste and 3% during the processing of the second variety of wheat. after the processing, the amount of remaining wheat was 1,364 tons. how many tons of each variety of wheat was delivered to the silo?
Answers: 1
Mathematics, 21.06.2019 23:10, ammarsico19
Tom travels between the two mile markers shown and then finds his average speed in miles per hour. select the three equations that represent this situation.
Answers: 1
Mathematics, 22.06.2019 00:20, destinyd10189
Ze trinomial x2 + bx – c has factors of (x + m)(x – n), where m, n, and b are positive. what is ze relationship between the values of m and n? explain how you got ze answer
Answers: 2
Mathematics, 22.06.2019 02:30, misk980
Atrain traveled for 1.5 hours to the first station, stopped for 30 minutes, then traveled for 4 hours to the final station where it stopped for 1 hour. the total distance traveled is a function of time. which graph most accurately represents this scenario? a graph is shown with the x-axis labeled time (in hours) and the y-axis labeled total distance (in miles). the line begins at the origin and moves upward for 1.5 hours. the line then continues upward at a slow rate until 2 hours. from 2 to 6 hours, the line continues quickly upward. from 6 to 7 hours, it moves downward until it touches the x-axis a graph is shown with the axis labeled time (in hours) and the y axis labeled total distance (in miles). a line is shown beginning at the origin. the line moves upward until 1.5 hours, then is a horizontal line until 2 hours. the line moves quickly upward again until 6 hours, and then is horizontal until 7 hours a graph is shown with the axis labeled time (in hours) and the y-axis labeled total distance (in miles). the line begins at the y-axis where y equals 125. it is horizontal until 1.5 hours, then moves downward until 2 hours where it touches the x-axis. the line moves upward until 6 hours and then moves downward until 7 hours where it touches the x-axis a graph is shown with the axis labeled time (in hours) and the y-axis labeled total distance (in miles). the line begins at y equals 125 and is horizontal for 1.5 hours. the line moves downward until 2 hours, then back up until 5.5 hours. the line is horizontal from 5.5 to 7 hours
Answers: 1
Do you know the correct answer?
The table shows the times of the gold, silver, and bronze medal winners for the men's 100-meter race...
Questions in other subjects:

Social Studies, 01.11.2020 20:30
Mathematics, 01.11.2020 20:30


Physics, 01.11.2020 20:30

Mathematics, 01.11.2020 20:30
Mathematics, 01.11.2020 20:30

Mathematics, 01.11.2020 20:30


