


The diagram shows how data demand increases with data variety and complexity.
based on the ill...

Mathematics, 24.09.2019 04:30, gingerham1
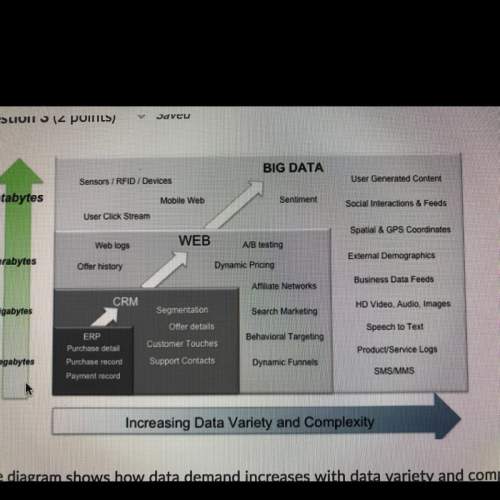
The diagram shows how data demand increases with data variety and complexity.
based on the illustration, determine the correct order of data variety and complexity
from least to greatest.
web logs < dynamic funnels < sms/mms
sms/mms < gps coordinates < click stream
dynamic funnels < gps coordinates < mobile web
mobile web < speech to text < dynamic funnels

Answers: 3
Other questions on the subject: Mathematics
Mathematics, 21.06.2019 22:30, brendaslater49p6ttxt
We have 339 ounces of jam to be divided up equally for 12 people how muny ounces will each person get
Answers: 1
Mathematics, 21.06.2019 22:50, tali2561
Aclassroom is made up of 11 boys and 14 girls. the teacher has four main classroom responsibilities that she wants to hand out to four different students (one for each of the four students). if the teacher chooses 4 of the students at random, then what is the probability that the four students chosen to complete the responsibilities will be all boys?
Answers: 1
Mathematics, 21.06.2019 23:00, LillianMRucker
Atriangle in the coordinates of (2,3), (-4,5) and (-2,4) it is translated 3 units down. what are it’s new coordinates
Answers: 1
Do you know the correct answer?
Questions in other subjects:
Mathematics, 17.08.2019 21:10

Business, 17.08.2019 21:10


English, 17.08.2019 21:10

Law, 17.08.2019 21:10
Law, 17.08.2019 21:10

History, 17.08.2019 21:10


