


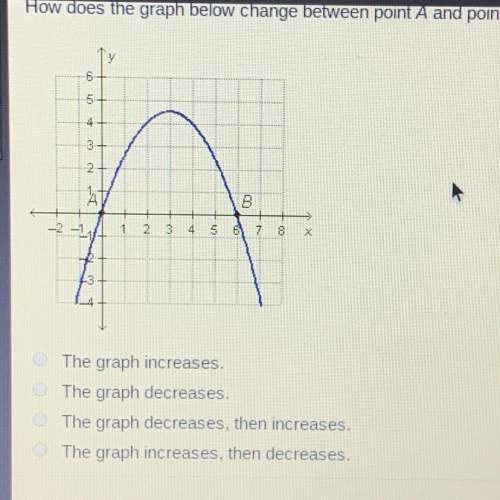
How does the graph below change between point a and point b
the graph increases.
the gra...

Mathematics, 23.09.2019 22:20, wowihavefun
How does the graph below change between point a and point b
the graph increases.
the graph decreases.
the graph decreases, then increases.
the graph increases, then decreases.

Answers: 2
Other questions on the subject: Mathematics
Mathematics, 21.06.2019 23:30, olivialaine31
Will give brainliest for correct answer 8. use the distance time graph to answer these questions: a. what does the graph tell us about the velocity of the car? b. what is the average velocity of the car? (show work) c. is the velocity reflected in the graph positive or negative?d. is there any point on the graph where the car is not moving? how do we know?
Answers: 1
Mathematics, 21.06.2019 23:30, byron17
Select the correct answer from each drop-down menu. james needs to clock a minimum of 9 hours per day at work. the data set records his daily work hours, which vary between 9 hours and 12 hours, for a certain number of days. {9, 9.5, 10, 10.5, 10.5, 11, 11, 11.5, 11.5, 11.5, 12, 12}. the median number of hours james worked is . the skew of the distribution is
Answers: 3
Do you know the correct answer?
Questions in other subjects:

Computers and Technology, 24.02.2020 17:41


English, 24.02.2020 17:42


