

Mathematics, 23.09.2019 21:00, reginaldlegette
Given that events "a" and "b" are independent, p(a)= 0.80 and p(a and b) = 0.24, what is p (b)?
group of answer choices
0.104
0.192
0.56
0.30
a weather forecaster predicts that their is 50% chance of rain on saturday and a 40% chance of rain on sunday. if these probabilities are correct, what is the probability that it will rain both days?
group of answer choices
20%
45%
10%
90%
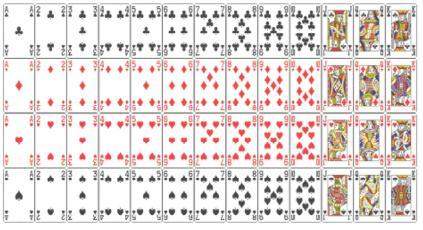
a card is randomly drawn from a shuffled deck of cards and not replaced. a second card is drawn from the remaining shuffled cards. what is the approximate probability that both cards are red?
49%
50%
24.5%
25%

Answers: 2


Other questions on the subject: Mathematics
Mathematics, 21.06.2019 14:50, 2022vaneeanika51
S-7< 3 i need answering this problem someone asap answer
Answers: 1
Mathematics, 21.06.2019 18:30, nina288
Astuntman jumping off a 20-m-high building is modeled by the equation h=20-5t^2, where t is the same in seconds. a high-speed camera is ready to film him between 15m and 10m above the ground. for which interval of time should the camera film him?
Answers: 1
Mathematics, 21.06.2019 19:10, brownzackery71
Girardo is using the model below to solve the equation . girardo uses the following steps: step 1 add 4 negative x-tiles to both sides step 2 add 1 negative unit tile to both sides step 3 the solution is which step could be adjusted so that gerardo's final step results in a positive x-value? in step 1, he should have added 4 positive x-tiles to both sides. in step 1, he should have added 3 negative x-tiles to both sides. in step 2, he should have added 4 negative unit tiles to both sides. in step 2, he should have added 1 positive unit tile to both sides.
Answers: 2
Mathematics, 22.06.2019 01:30, karsenbeau
Given are five observations for two variables, x and y. xi 1 2 3 4 5 yi 3 7 5 11 14 which of the following is a scatter diagrams accurately represents the data? what does the scatter diagram developed in part (a) indicate about the relationship between the two variables? try to approximate the relationship betwen x and y by drawing a straight line through the data. which of the following is a scatter diagrams accurately represents the data? develop the estimated regression equation by computing the values of b 0 and b 1 using equations (14.6) and (14.7) (to 1 decimal). = + x use the estimated regression equation to predict the value of y when x = 4 (to 1 decimal). =
Answers: 3
Do you know the correct answer?
Given that events "a" and "b" are independent, p(a)= 0.80 and p(a and b) = 0.24, what is p (b)?
Questions in other subjects:


Advanced Placement (AP), 22.01.2021 01:00


Spanish, 22.01.2021 01:00
Mathematics, 22.01.2021 01:00
Mathematics, 22.01.2021 01:00
Mathematics, 22.01.2021 01:00


