


5. the dot plot represents the distribution of wages earned during a one-week period
by 12 coll...

Mathematics, 23.09.2019 09:30, jfrey7621
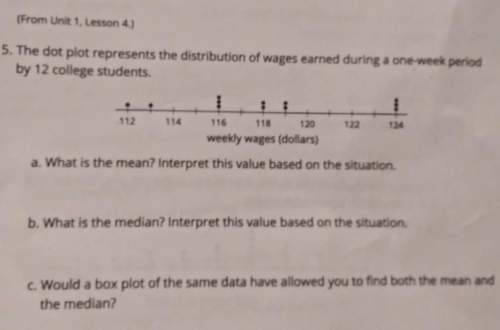
5. the dot plot represents the distribution of wages earned during a one-week period
by 12 college students.
. 112 114 116 118 120 122 124
weekly wages (dollars)
a. what is the mean? interpret this value based on the situation.
b. what is the median? interpret this value based on the situation.
c. would a box plot of the same data have allowed you to find both the mean and
the median?

Answers: 1
Other questions on the subject: Mathematics
Mathematics, 21.06.2019 16:30, mildredelizam
Graph red beads cost $1 an ounce and gold beads cost $3 an ounce. juanita wants to purchase a 12-ounce mixture of red and gold beads that she can sell for $2 an ounce. the solution of the system shows the number of beads needed for juanita to break even. x + y = 12, x + 3y = 24 how many ounces of red beads will juanita buy to break even? how many ounces of gold beads will she buy?
Answers: 3
Mathematics, 21.06.2019 18:00, winterblanco
On saturday a souvenir shop had 125 customers. sixty four percent of the costumers paid with a credit card. how many costumers paid with cash?
Answers: 1
Mathematics, 21.06.2019 21:00, candicecorvette
Check all that apply. f is a function. f is a one-to-one function. c is a function. c is a one-to-one function.
Answers: 3
Do you know the correct answer?
Questions in other subjects:


English, 03.08.2019 00:30
Mathematics, 03.08.2019 00:30
Mathematics, 03.08.2019 00:30

Social Studies, 03.08.2019 00:30


